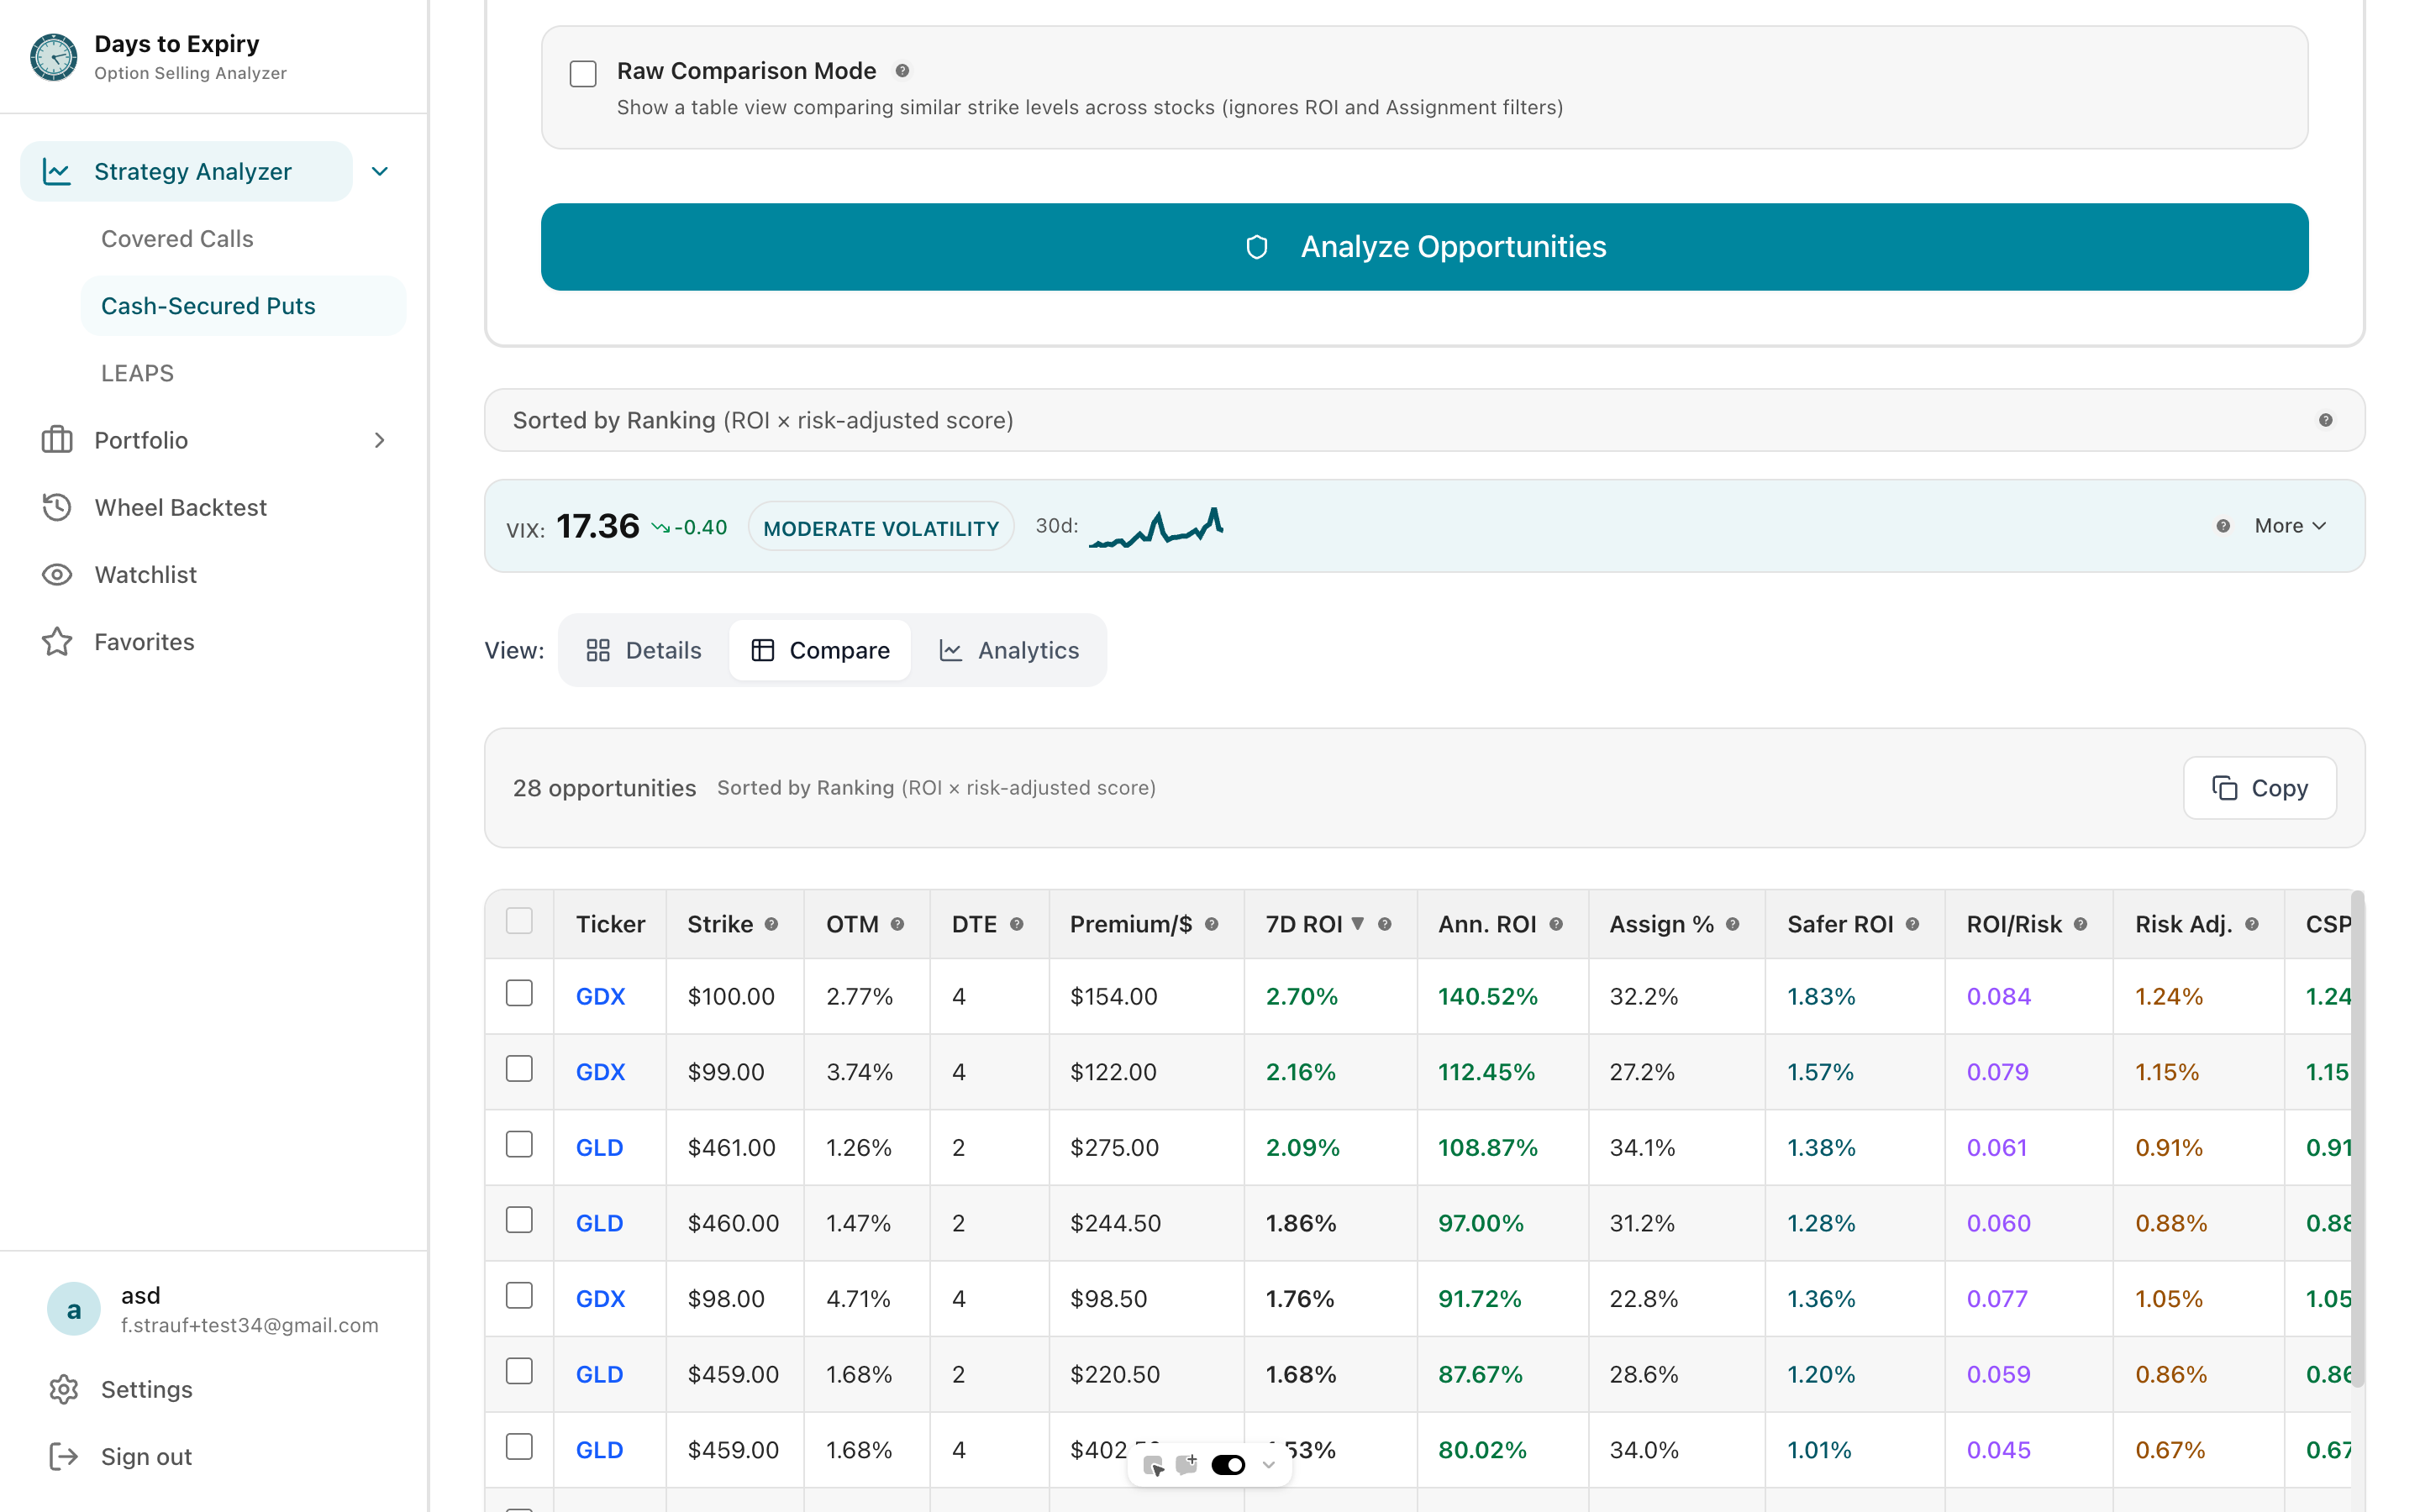
Find high-income covered call opportunities with historical assignment rates and true annualized ROI calculations
Most covered call screeners only show basic metrics—premiums, strike prices, and expiration dates. They don't tell you whether a trade is actually worth the risk. Our covered call screener goes deeper. Every opportunity is analyzed against historical data, showing you assignment probabilities and annualized returns so you can compare apples-to-apples.
Tap to view full size
No Historical Data — Basic metrics without assignment probability context
Manual ROI Calculations — Spending time calculating annualized returns in spreadsheets
Generic Recommendations — One-size-fits-all suggestions that ignore your strategy
Limited Analysis — No risk/reward breakdowns or P&L visualization
Know the odds before you trade with multi-year data on how often similar strikes were assigned.
Fair comparison across different timeframes so a 30-day trade can be weighed against a 60-day trade.
Screen for your specific goals and risk tolerance with DTE, delta, and OTM% controls.
Detailed risk/reward breakdowns for every opportunity including max profit and breakeven.
Store your preferred filter combinations and rerun them with one click.
Full screener access with premium upgrades available for advanced features.
Tap to view full size
Filter by minimum annualized income, max assignment probability, DTE range, and moneyness preferences
See opportunities ranked by risk-adjusted returns with historical assignment data
Click any result for complete trade analysis including max profit, breakeven, and downside protection
Trades Analyzed Daily
12,000+
Premium Tracked
$47M+
User Rating
4.8/5
Time to Screen
< 30 sec
Advanced real-time scanning with portfolio integration
Modern alternative to premium covered call tools
Validate screening criteria with historical data
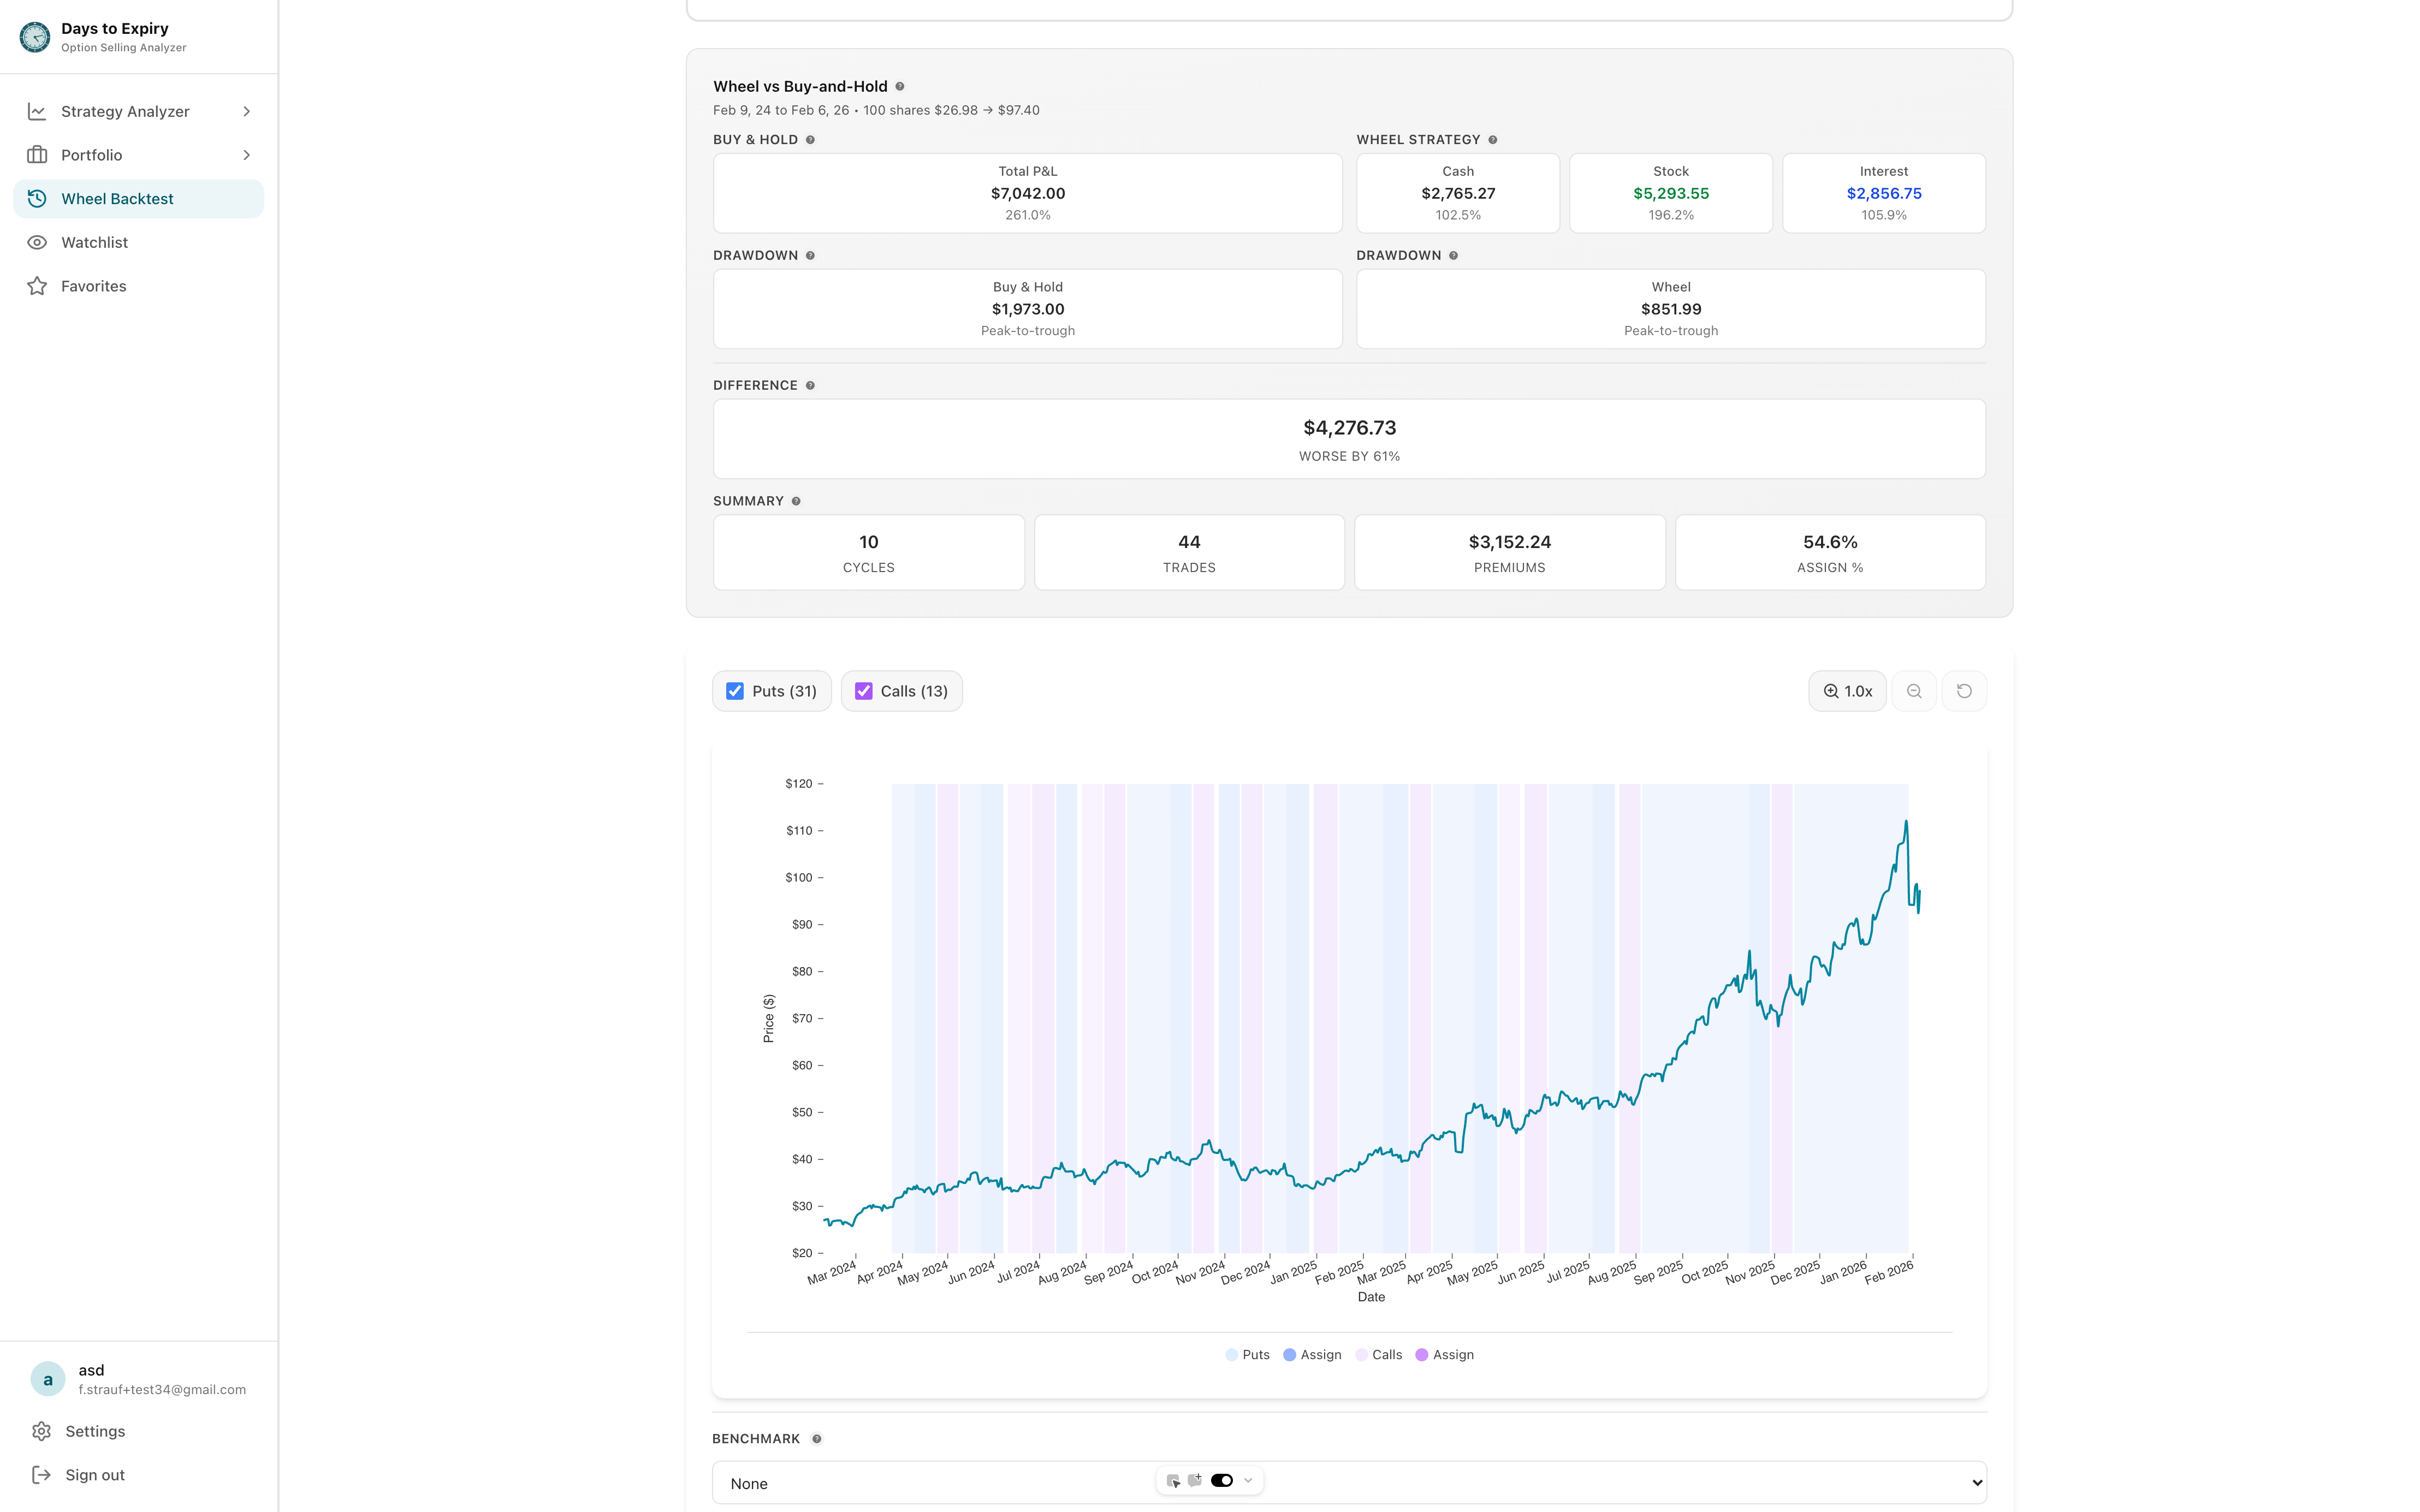
Complete wheel cycle management
Everything you need to know about getting started