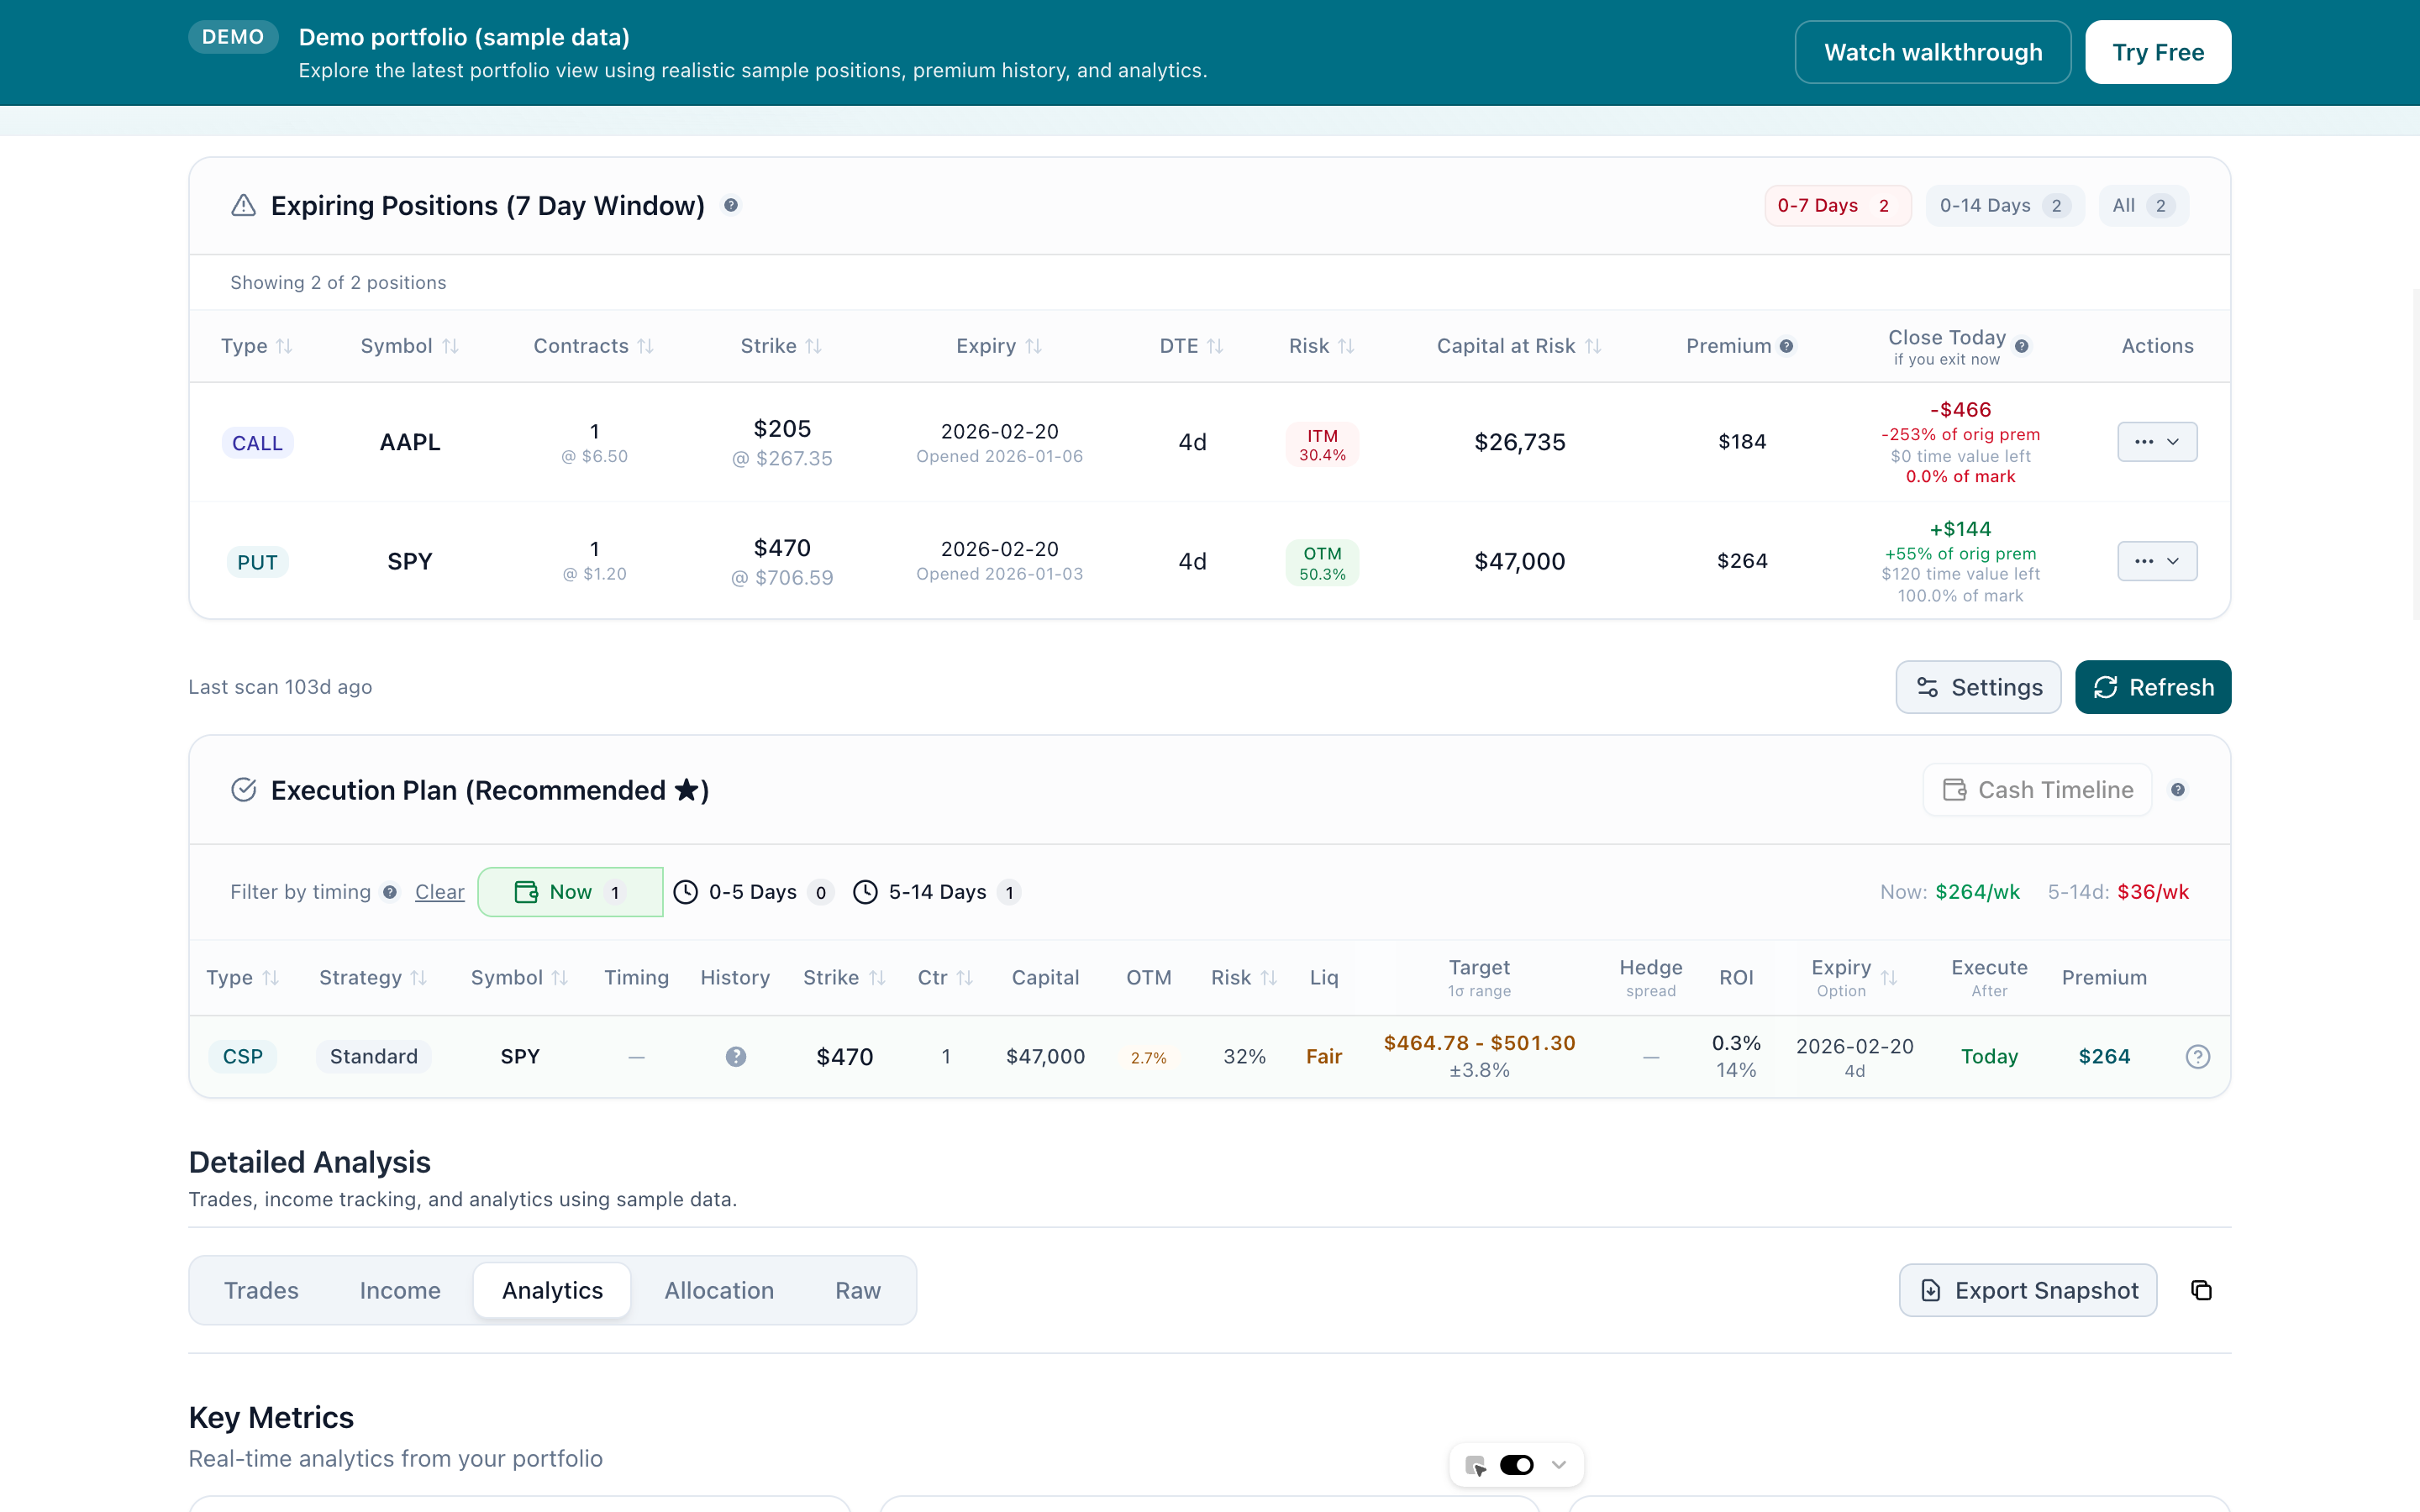
Your Portfolio, Analyzed by Expiration Cycle
Import your Interactive Brokers data via CSV or auto-sync. Review open positions by DTE, assignment risk, and premium capture so you know what needs attention before expiration week.
Tap to view full size
IBKR import + auto-sync
Upload your statement CSV or connect via the desktop app for automatic syncing. We normalize commissions, splits, and corporate actions.
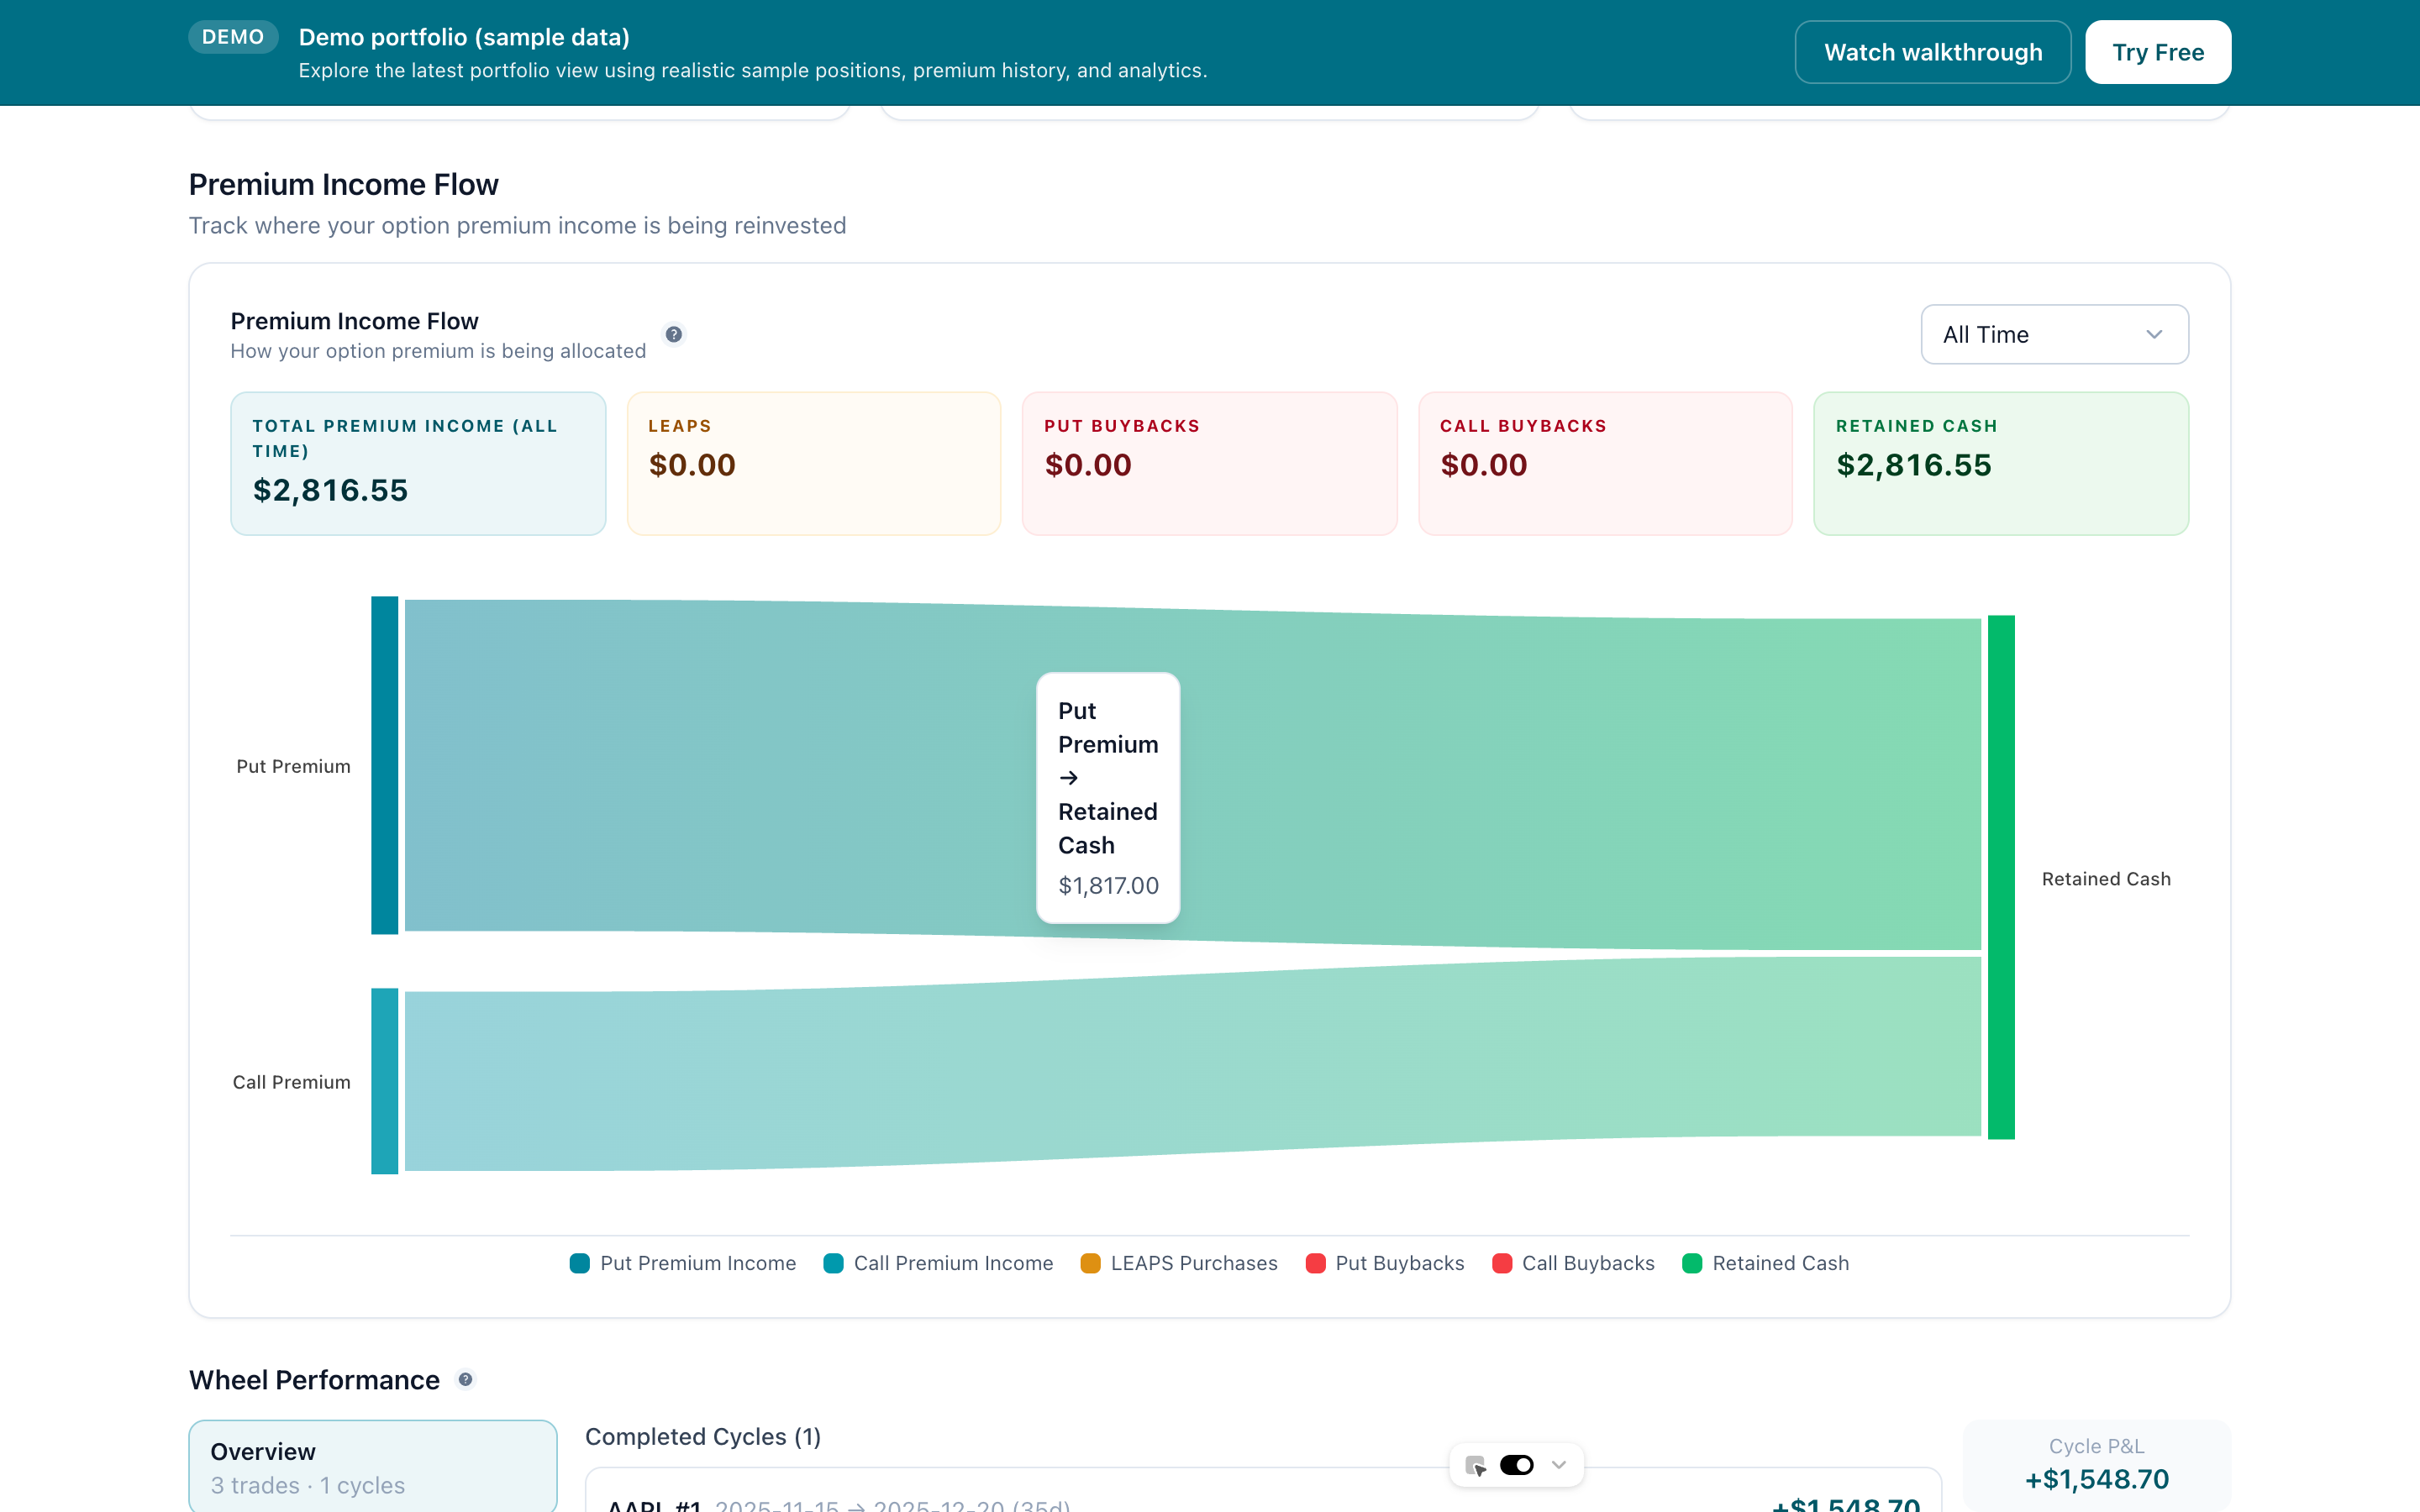
Income dashboard
Total premiums collected, weekly/monthly ROI, per-trade averages, and income broken down by underlying, expiration, or strategy.
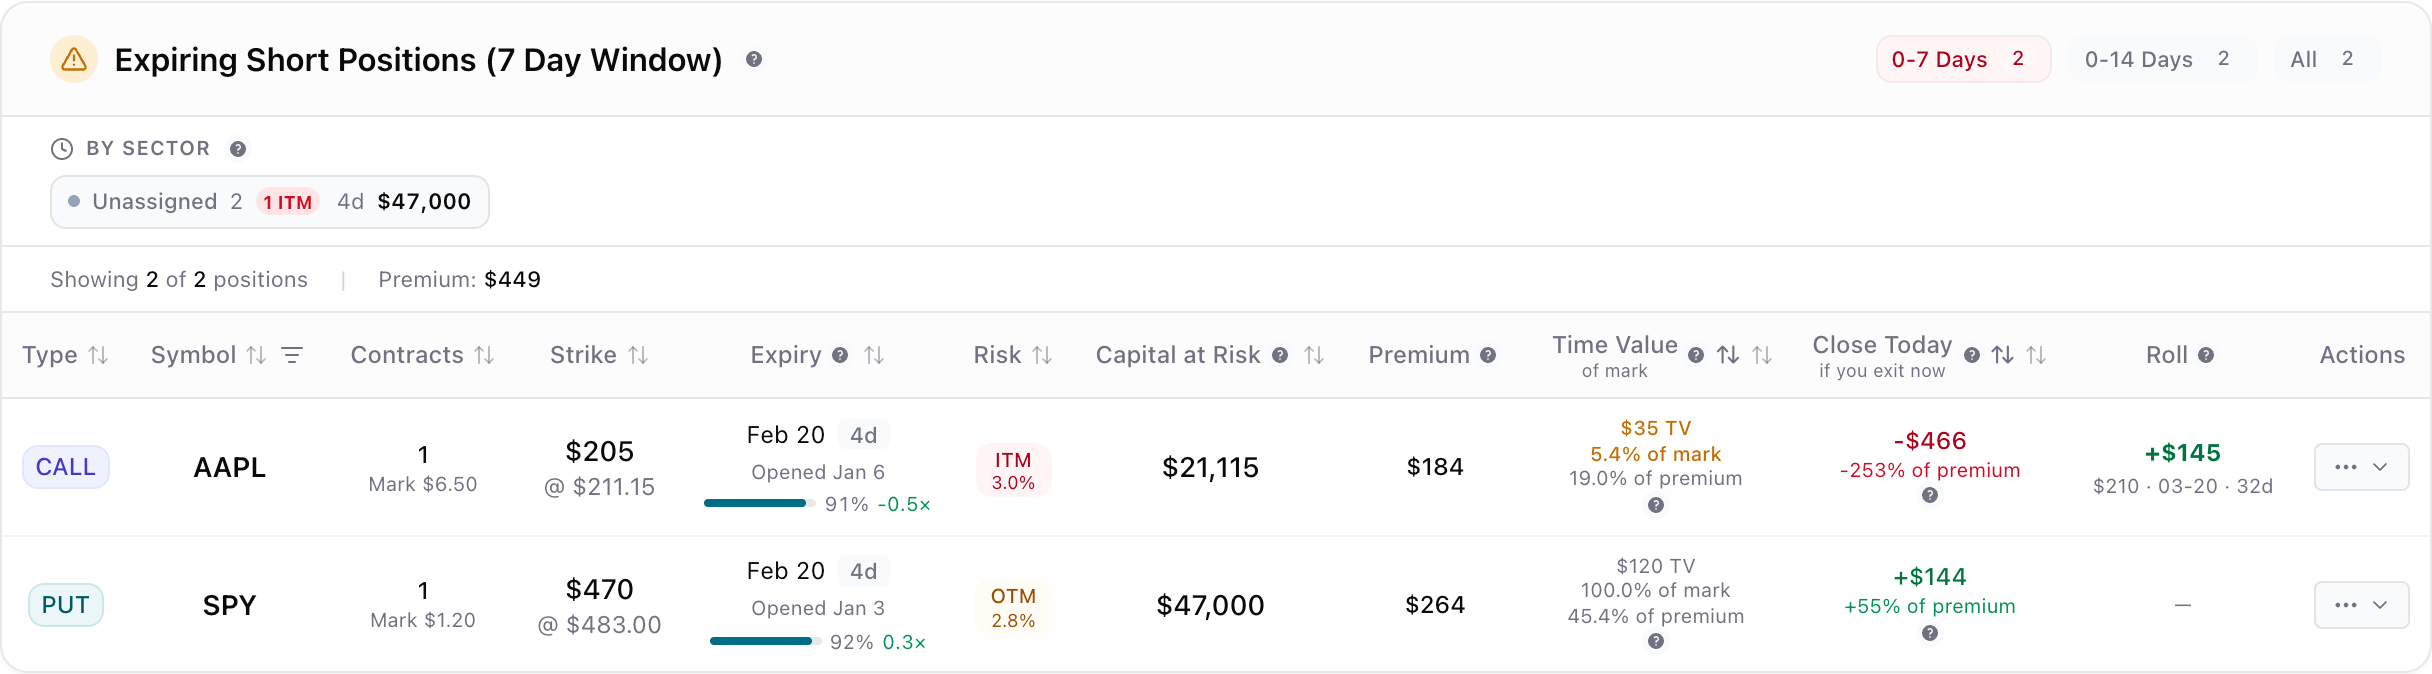
Coverage intelligence
See which holdings are fully covered, partially hedged, or naked. Understand your exposure at a glance.
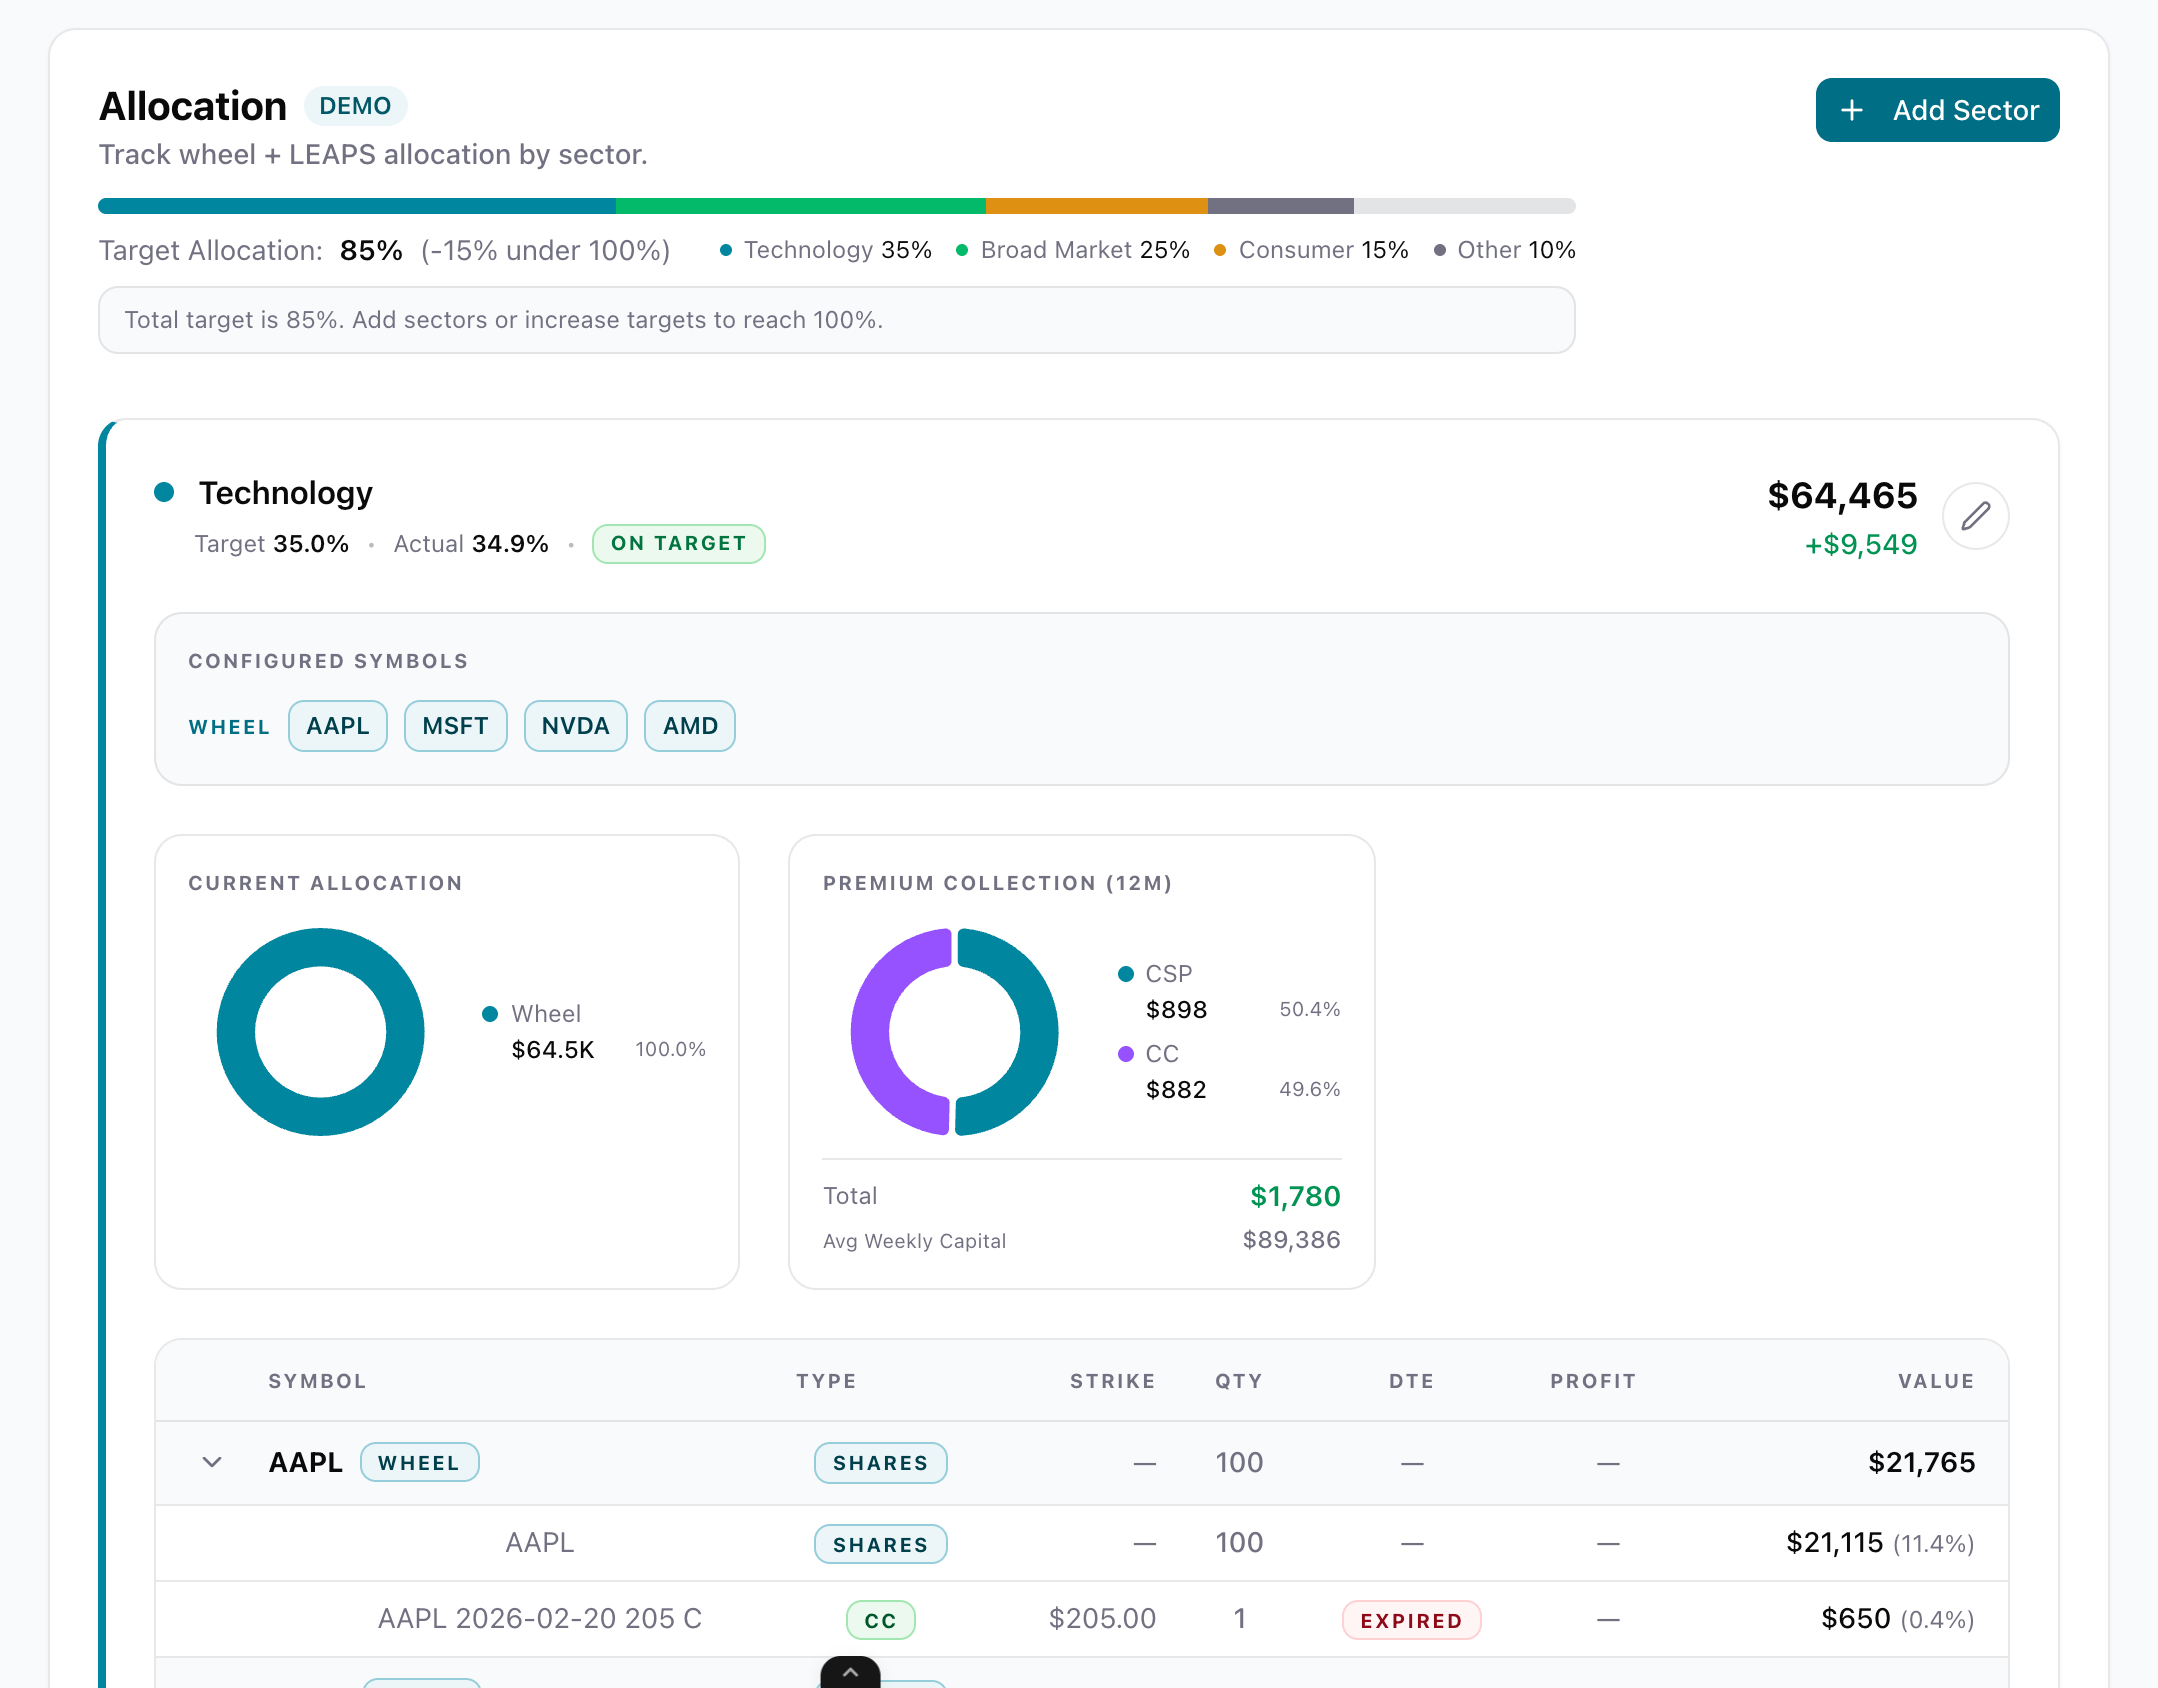
Sector breakdown
Group positions by sector to spot concentration risk and diversification opportunities across your wheel trades.
True Cost Basis and Take-Profit Clarity
IBKR obscures your real cost basis, especially after rolls and adjustments. See exactly what you paid, what you have collected, and what your true break-even is — per position, per leg, across any strategy.
Tap to view full size
Take-profit tracking
Set and monitor take-profit levels per position. See how close each trade is to your target and what premium remains to capture.
Roll-adjusted cost basis
Every roll, adjustment, and assignment is factored into your true cost basis. No more guessing after complex multi-leg trades.
Per-leg P&L
Break down multi-leg spreads and condors by individual leg. Understand which legs are profitable and which are dragging.
True break-even calculator
Account for collected premium, rolled credits, and assignment costs to see your actual break-even on every position.
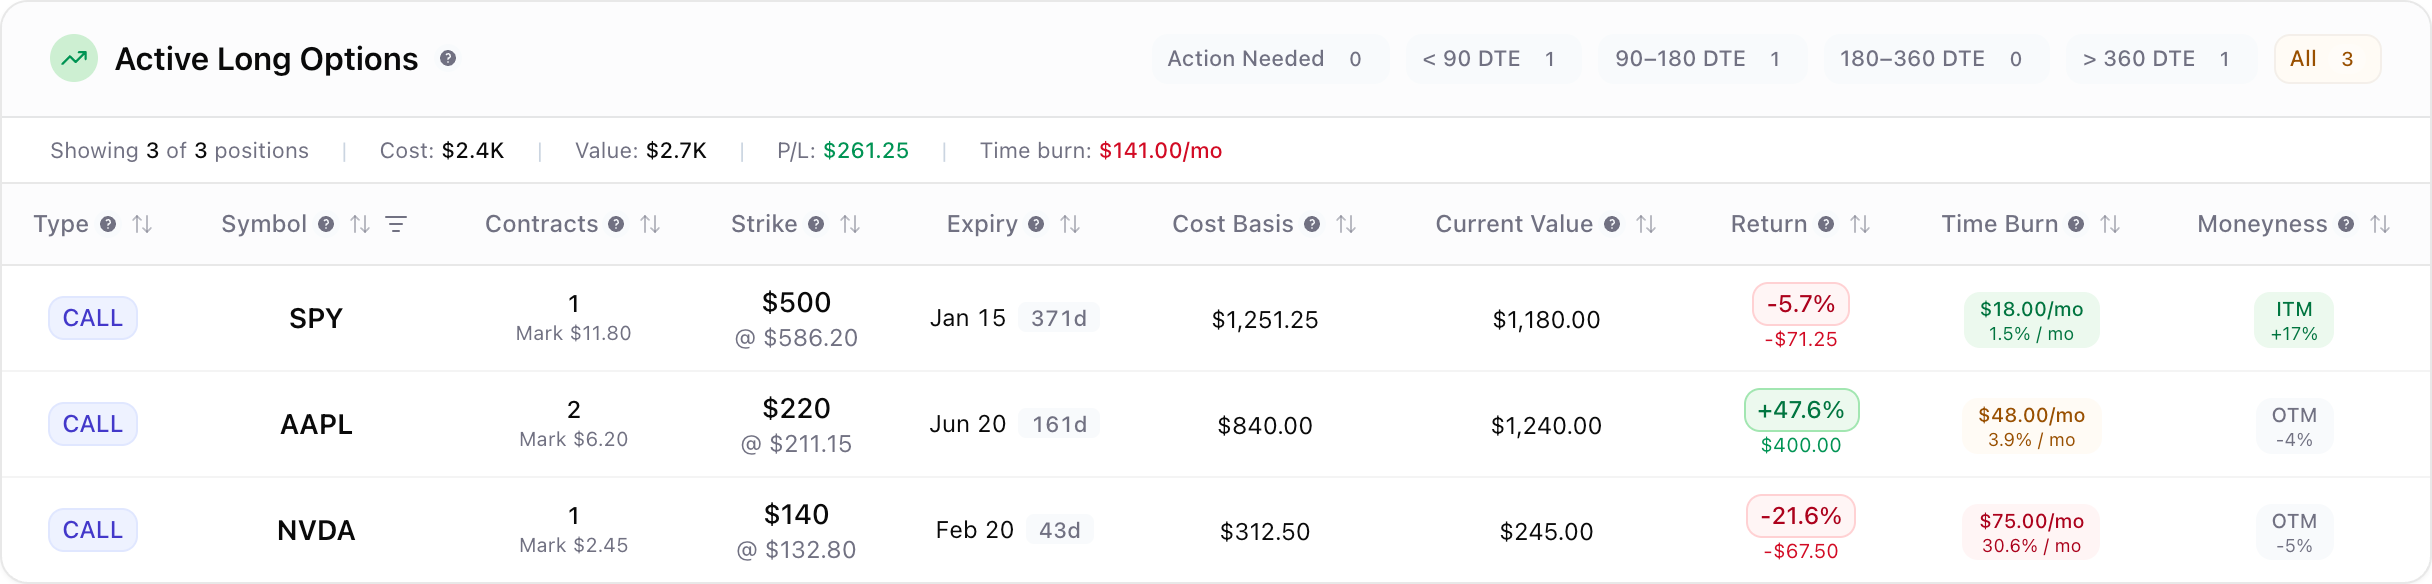
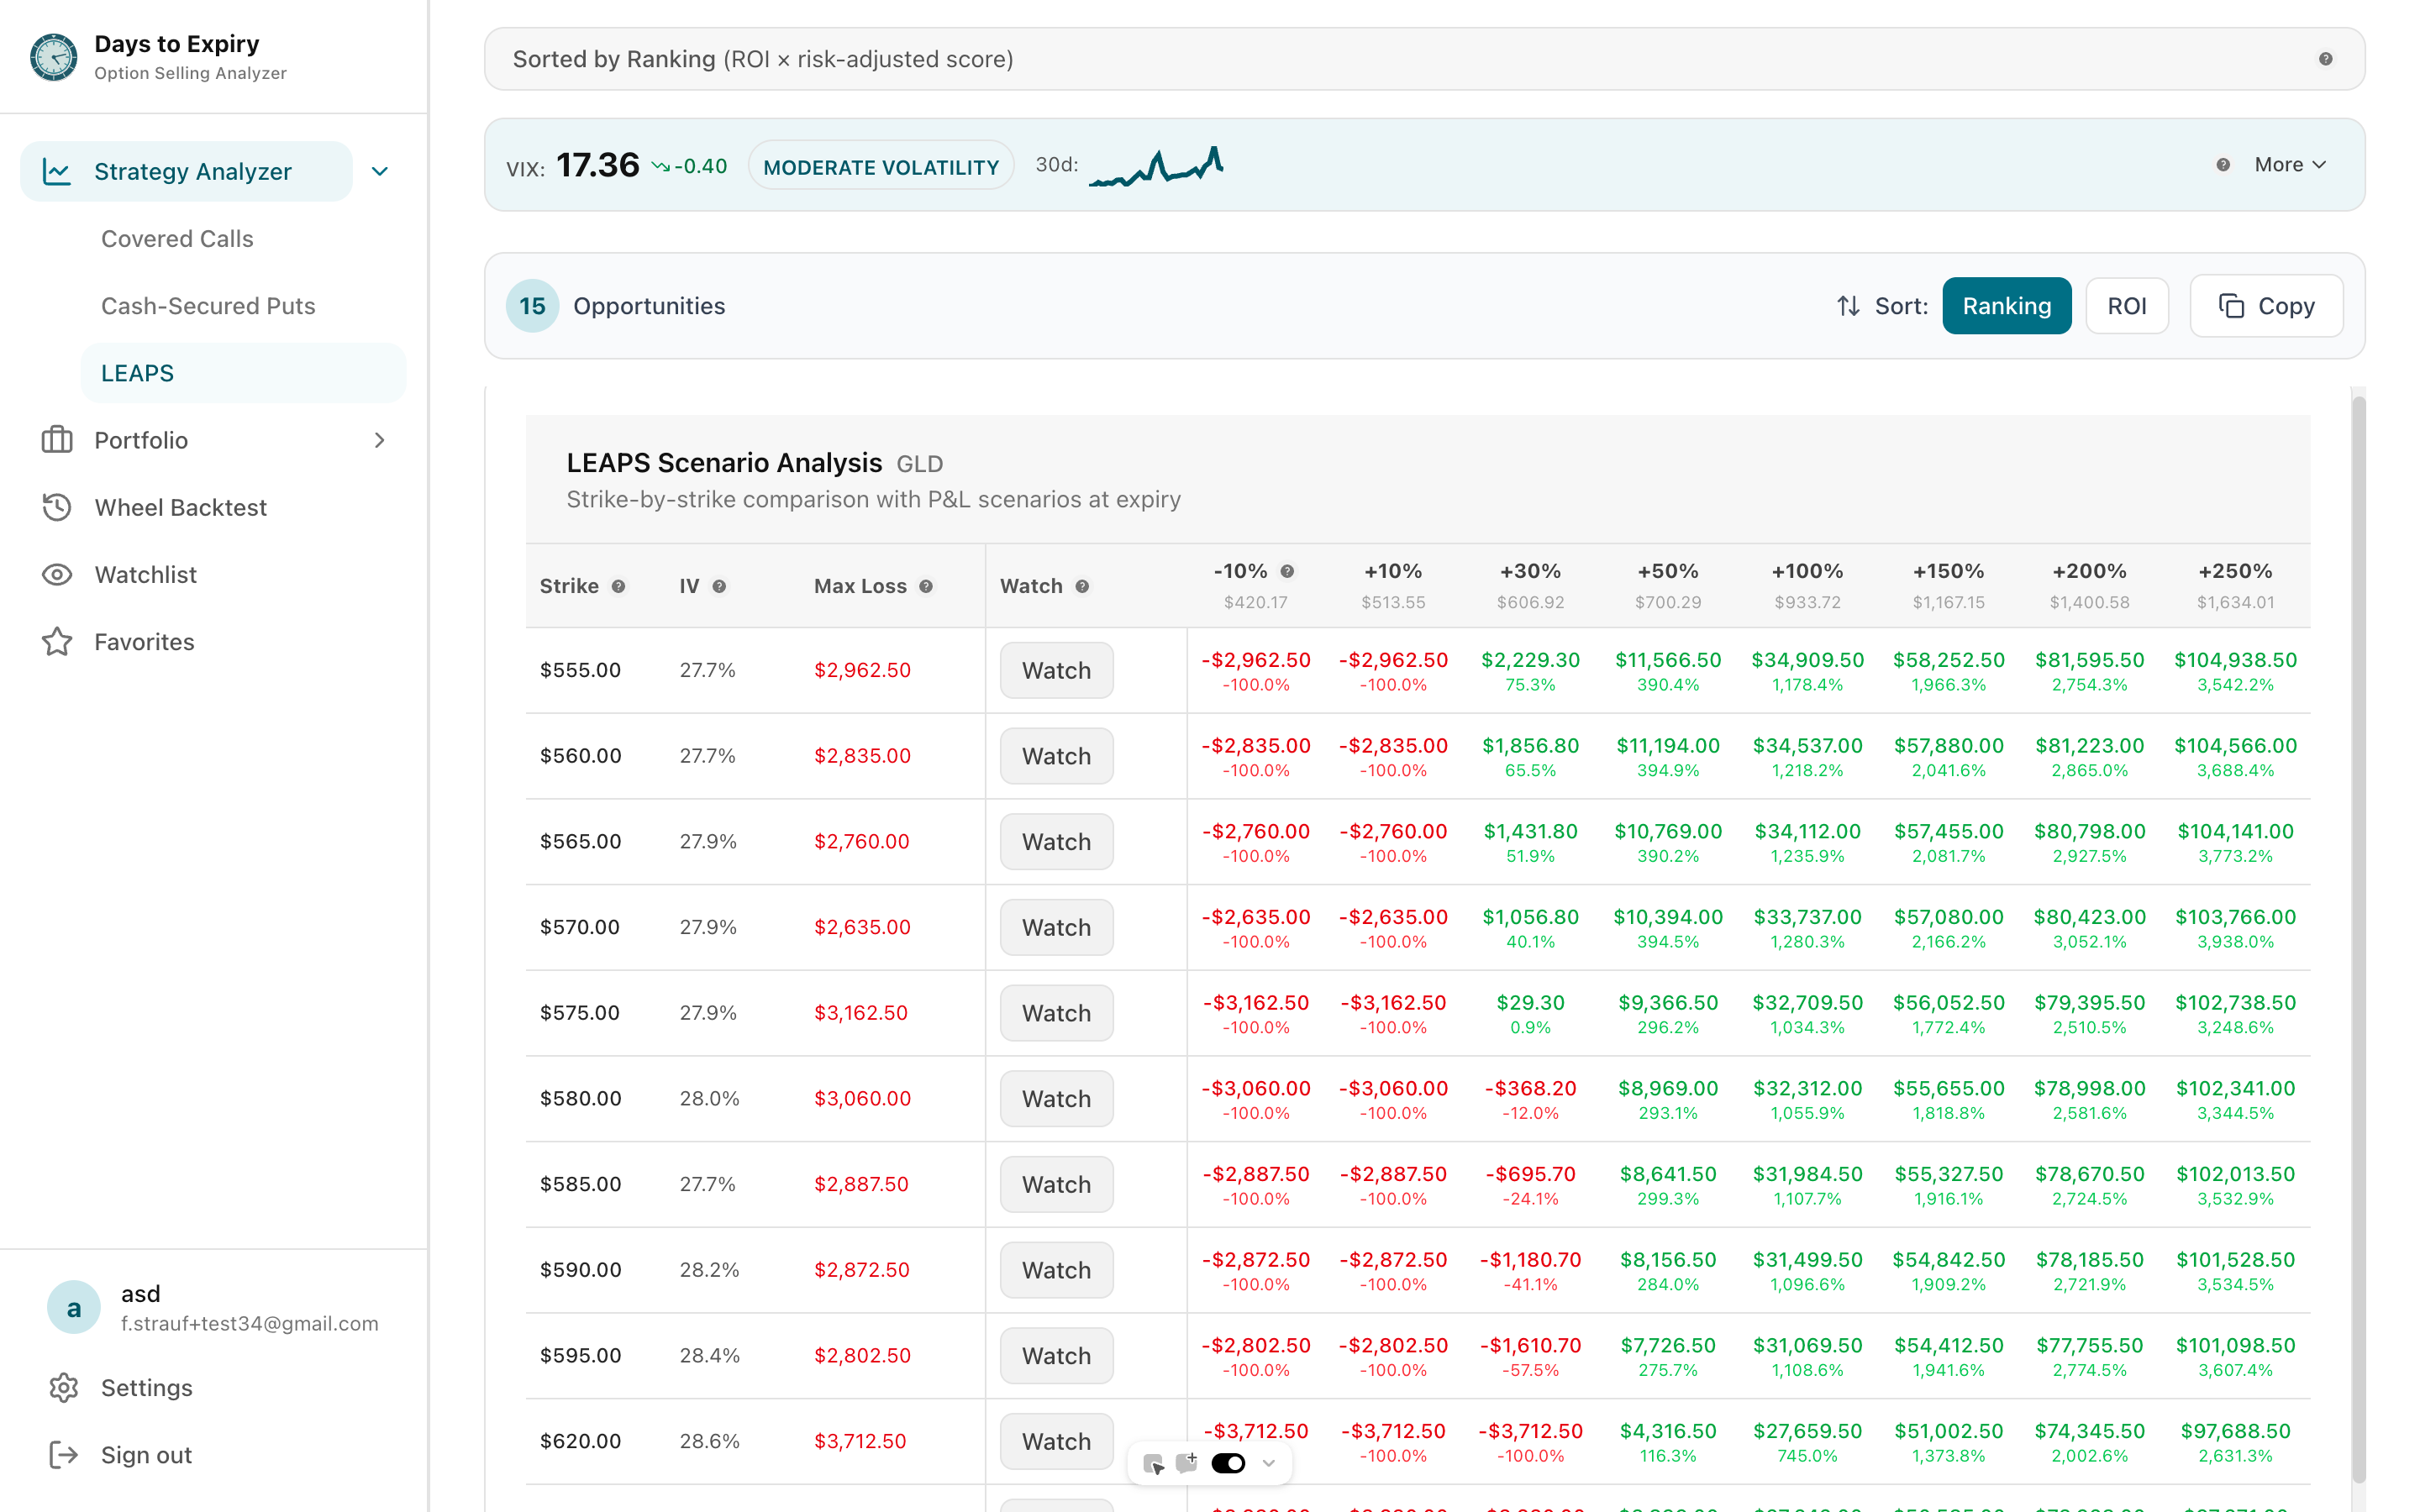
Long-Term Option Analytics
LEAPS are not just long calls — they are strategic allocations. Track performance, compare opportunities across tickers, and see how long-dated positions fit your portfolio over time.
Tap to view full size
Expiration timeline view
See all your LEAPS positions on a unified timeline. Track theta decay, remaining premium, and optimal exit windows at a glance.
Cross-ticker comparison
Compare LEAPS opportunities across multiple underlying symbols side-by-side with unified metrics for strike, premium, and projected ROI.
Performance attribution
Attribute P&L to time decay, delta movement, and volatility changes. Understand what is actually driving your long-option returns.
Barbell allocation tools
Model how much of your income to allocate to LEAPS versus wheel strategies. Test allocation percentages and see projected outcomes.
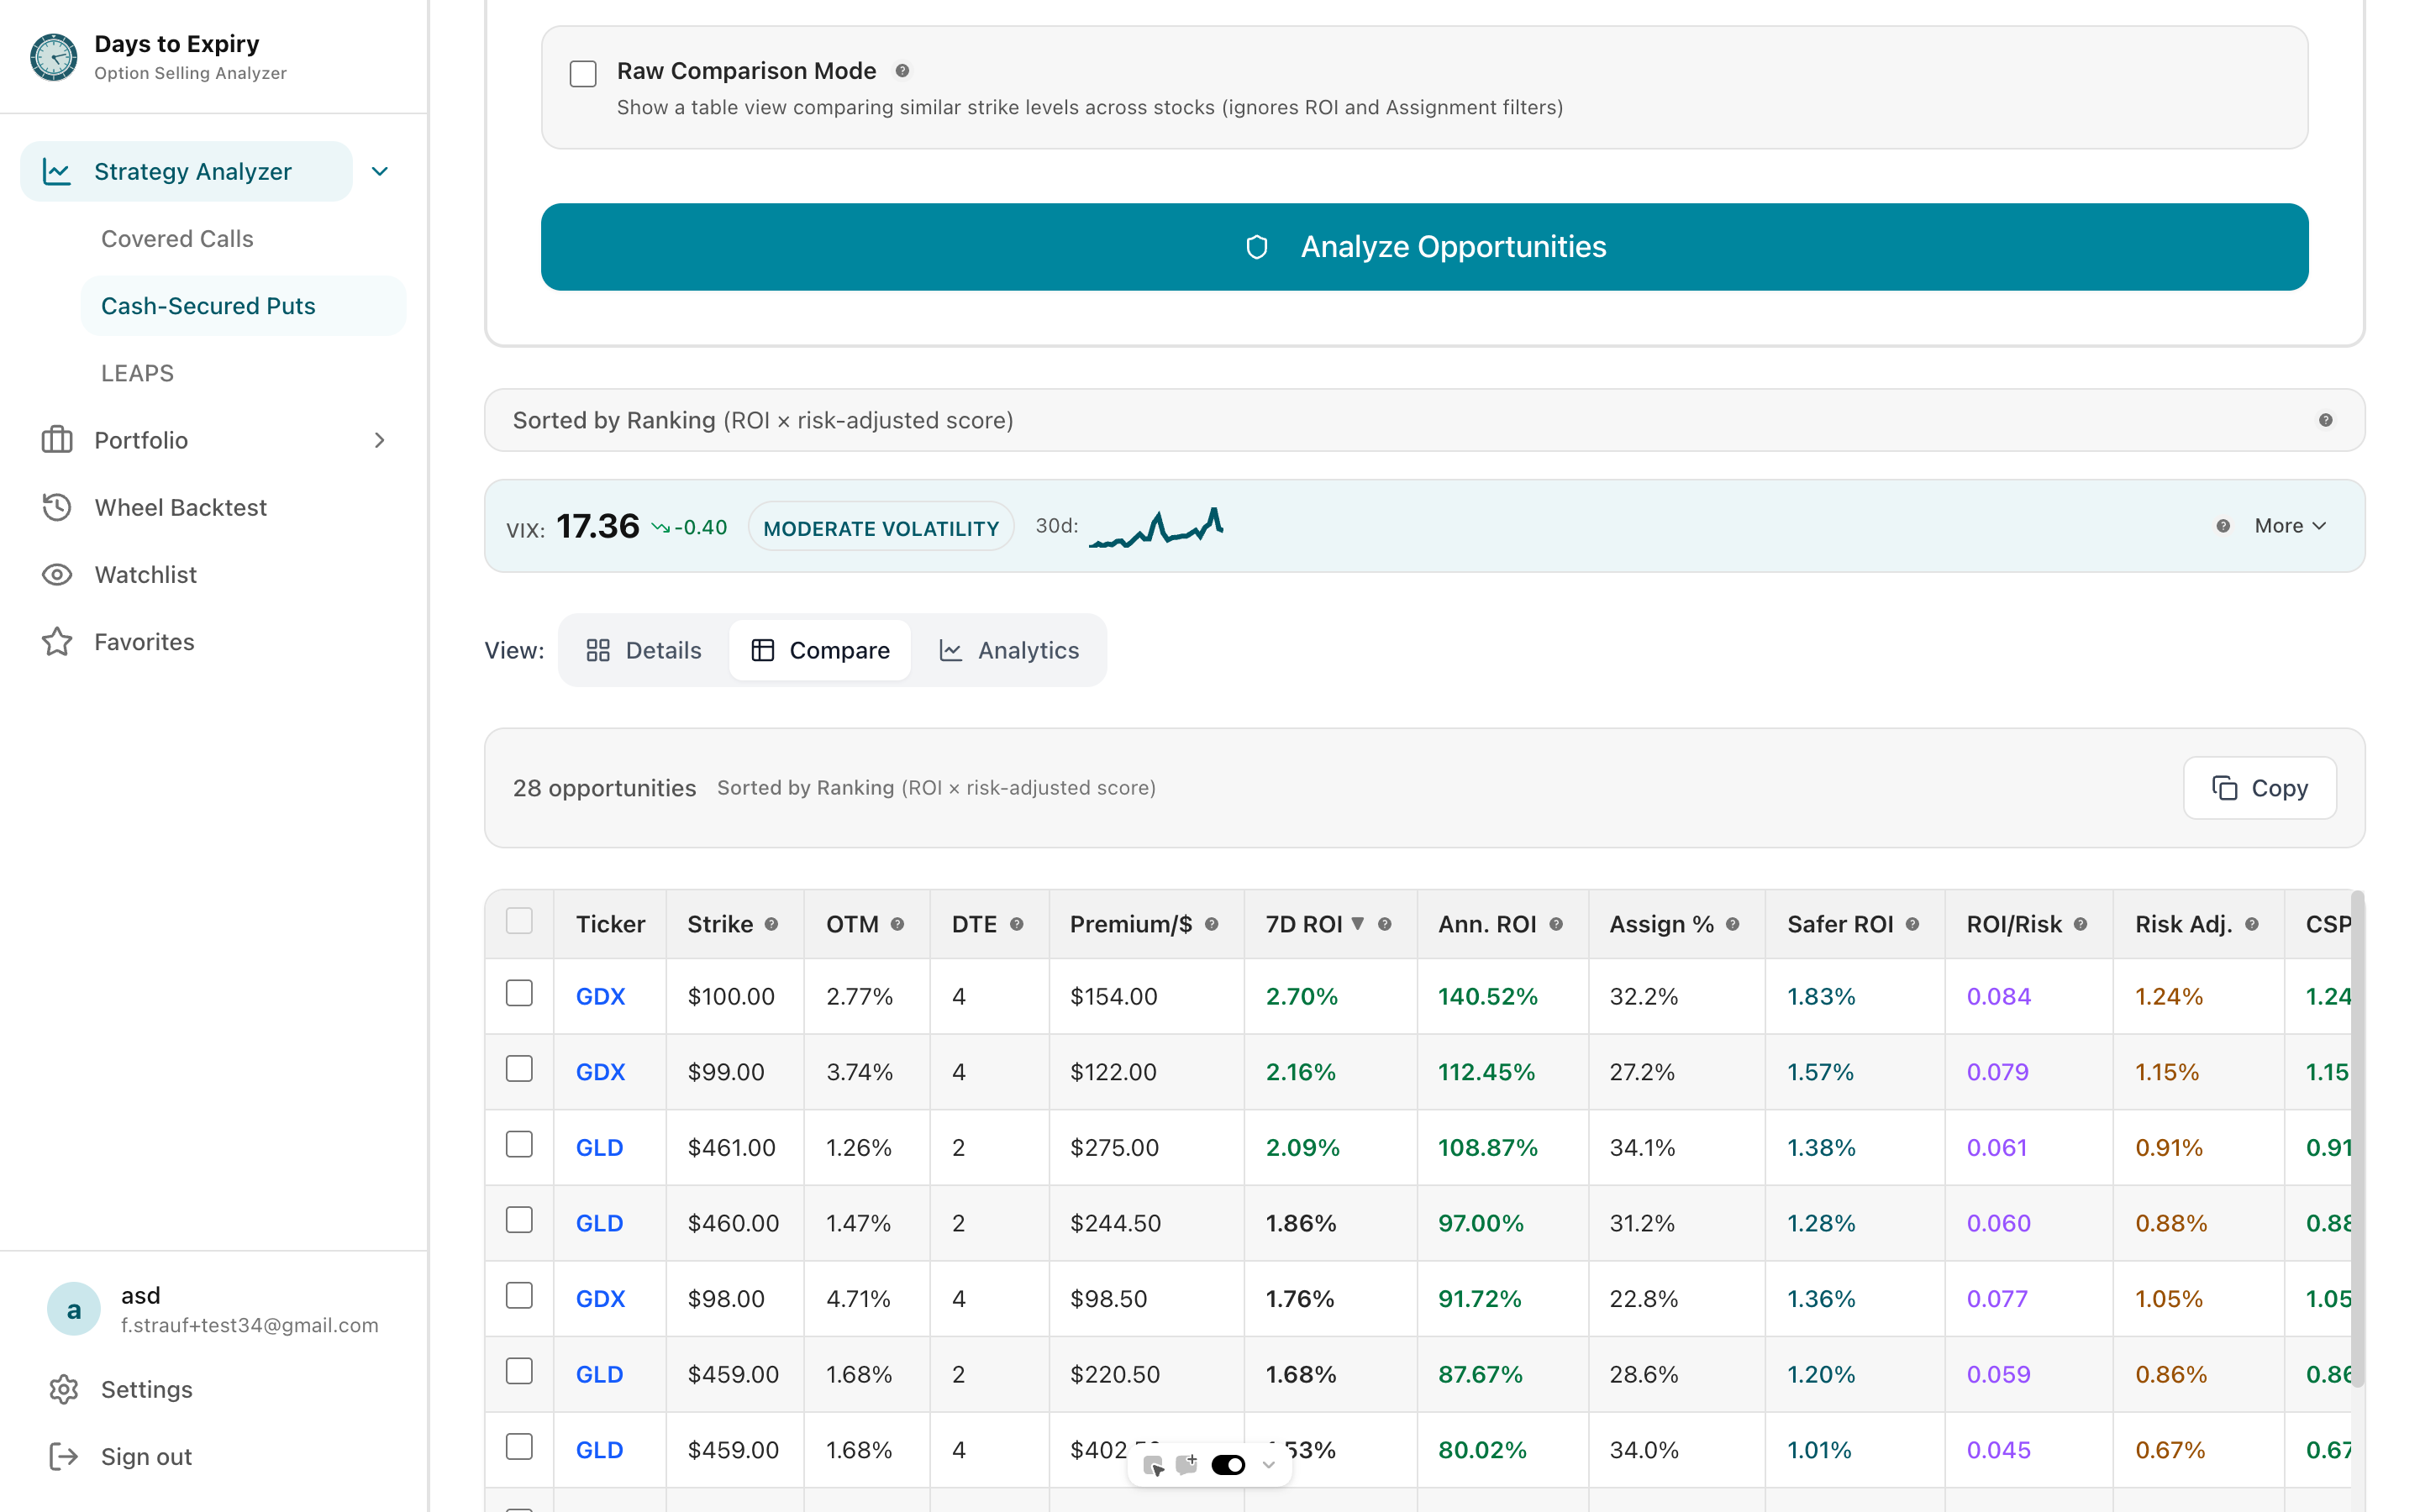
Scan the Next Action, Not Just the Next Trade
Filter opportunities by DTE, assignment probability, and premium. Compare setups side-by-side with live pricing and backtested context before committing capital.
Tap to view full size
Triple-strategy scanner
Toggle between covered calls, cash-secured puts, and long calls without losing context. Each strategy gets intelligently configured filters.
Live pricing
Real-time price pulls power every calculation — ROI, OTM%, assignment probability, and premium are always current.
Smart filters
Set assignment probability, ROI targets, and DTE ranges to pre-filter opportunities before results hit the screen.
Roll decision analyzer
When a position needs attention, compare roll options with projected outcomes to make the best move.
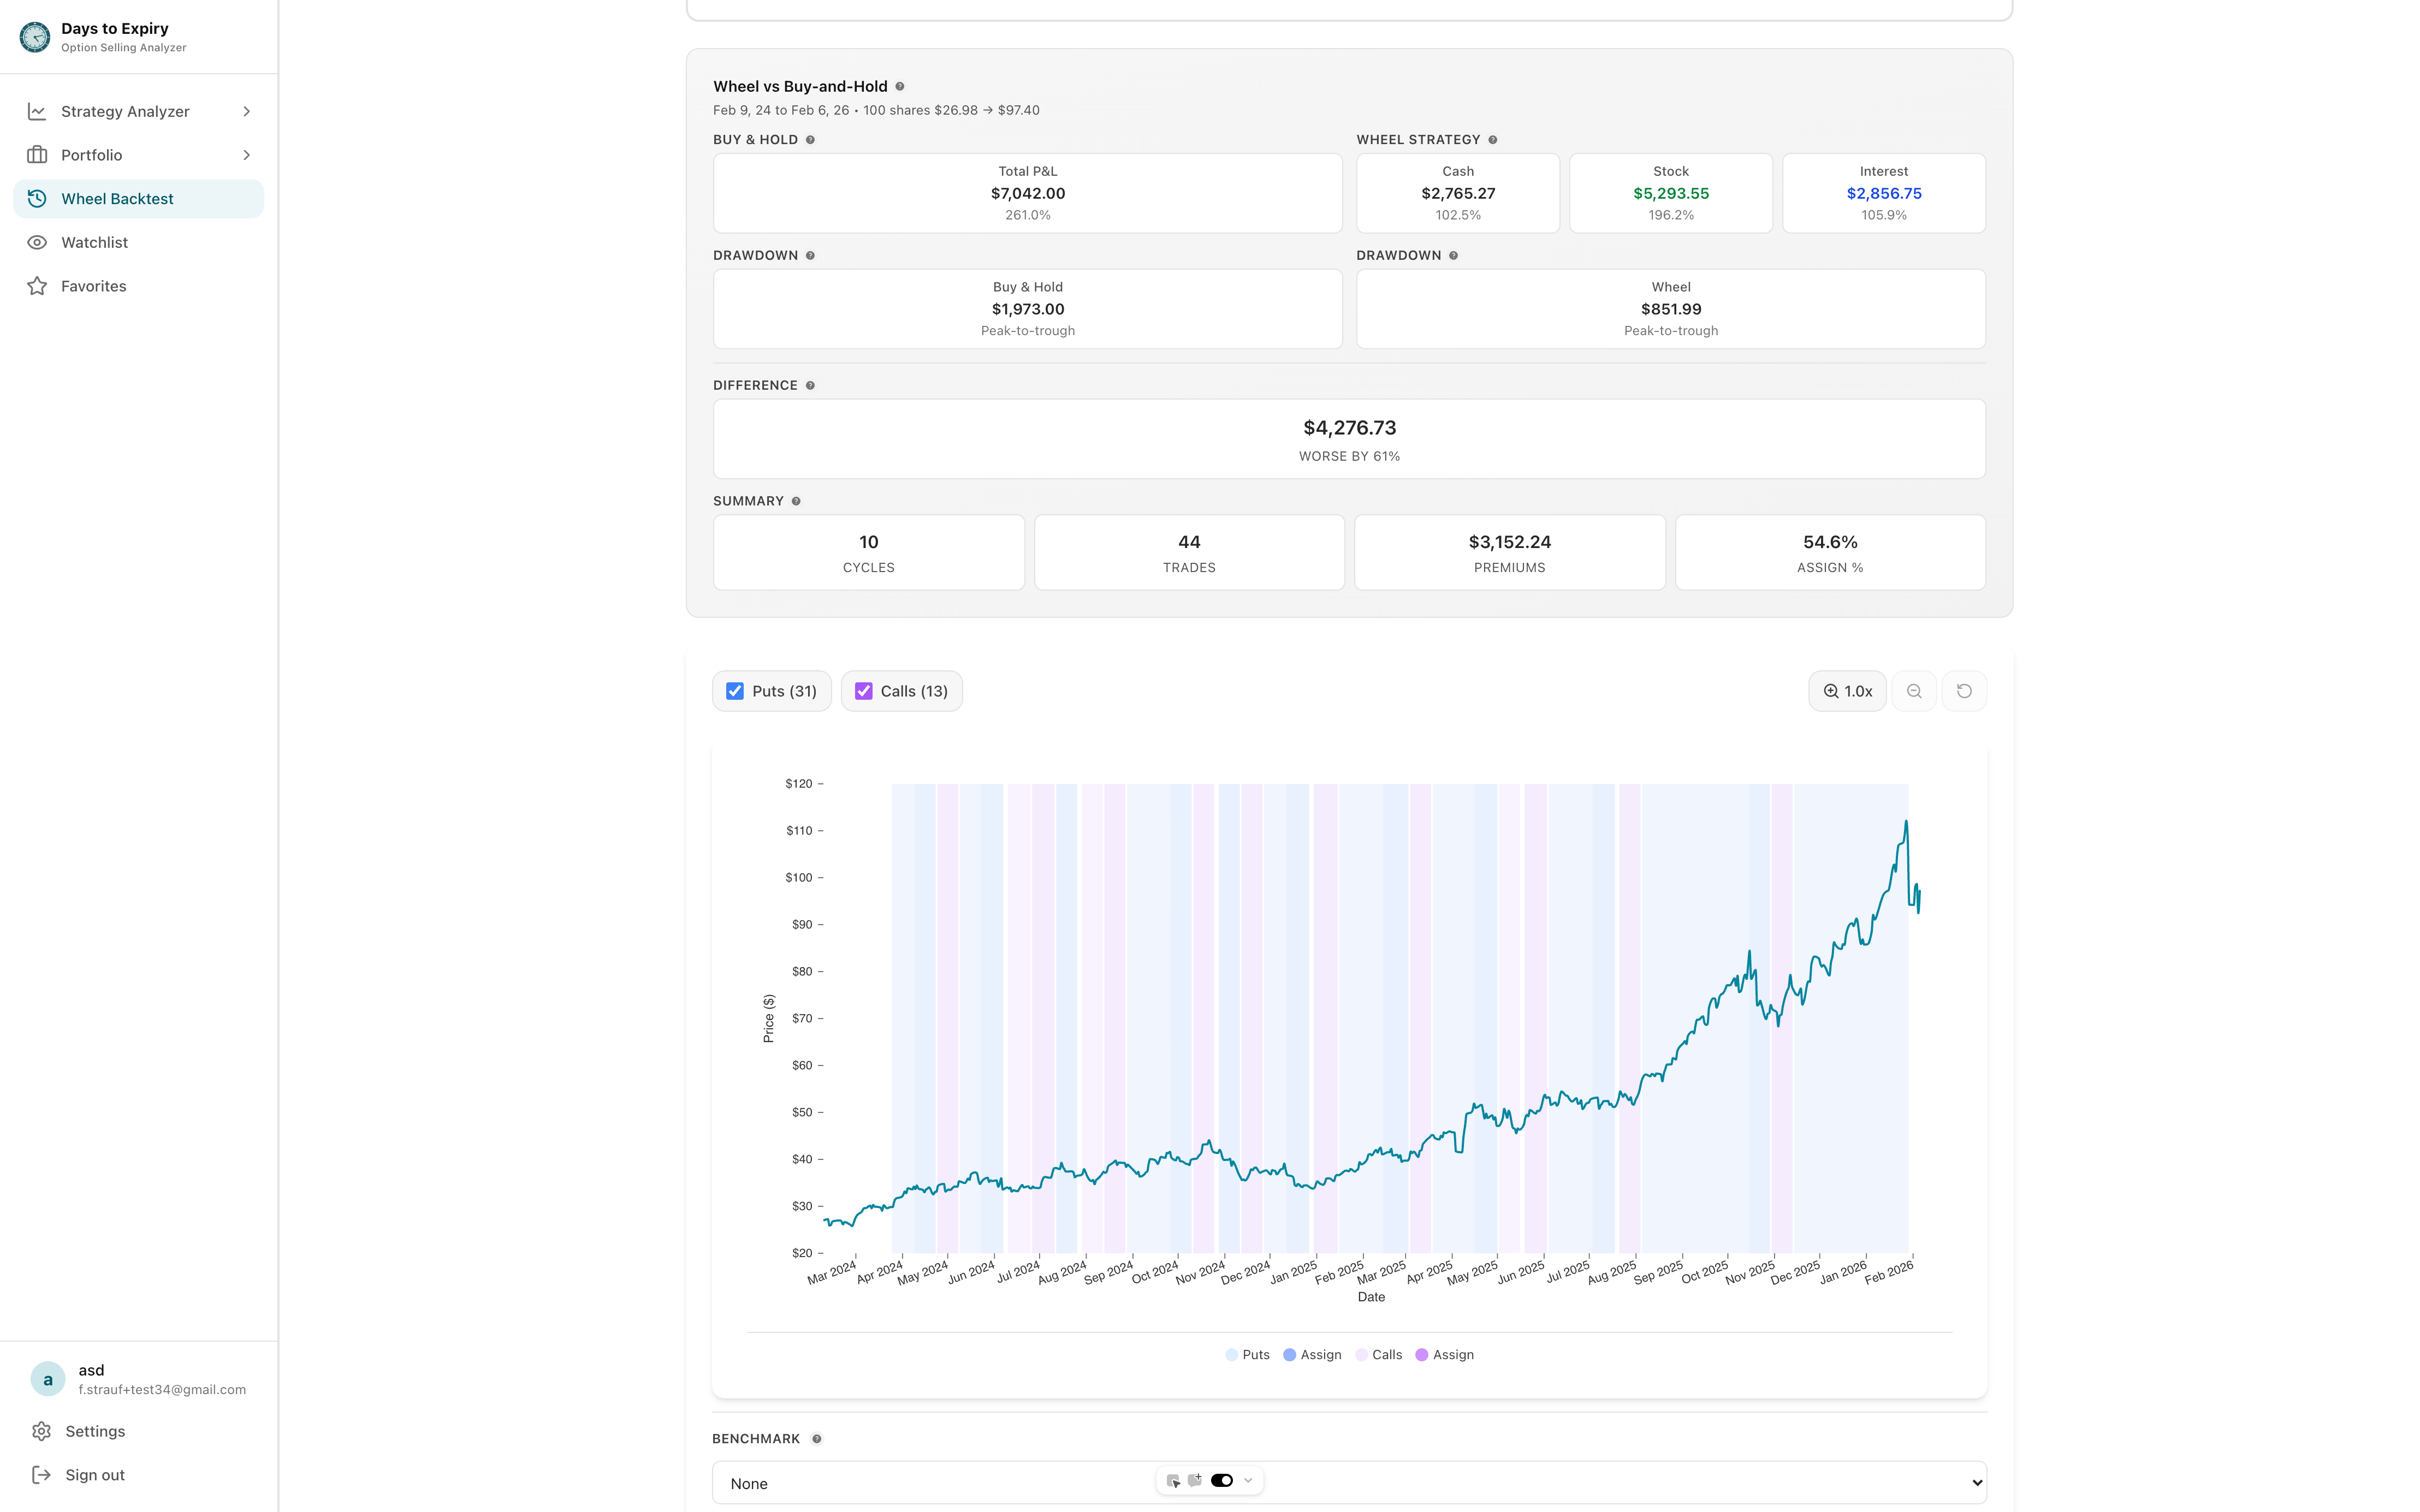
Validate Every Setup Before You Commit Capital
Backtest every opportunity against historical data. See assignment rates by strike and DTE, win/loss distribution, and average hold times so you enter with evidence, not hope.
Tap to view full size
Assignment distribution
Historical assignment rate by strike and DTE across multiple months. Know what actually happened with similar trades.
Win/loss analysis
Win rate, loss distribution, and average hold time so you understand the full risk profile of every candidate.
Real-time recalculation
Assignment chance and ROI update in real-time as prices move, so your analysis stays current throughout the trading day.
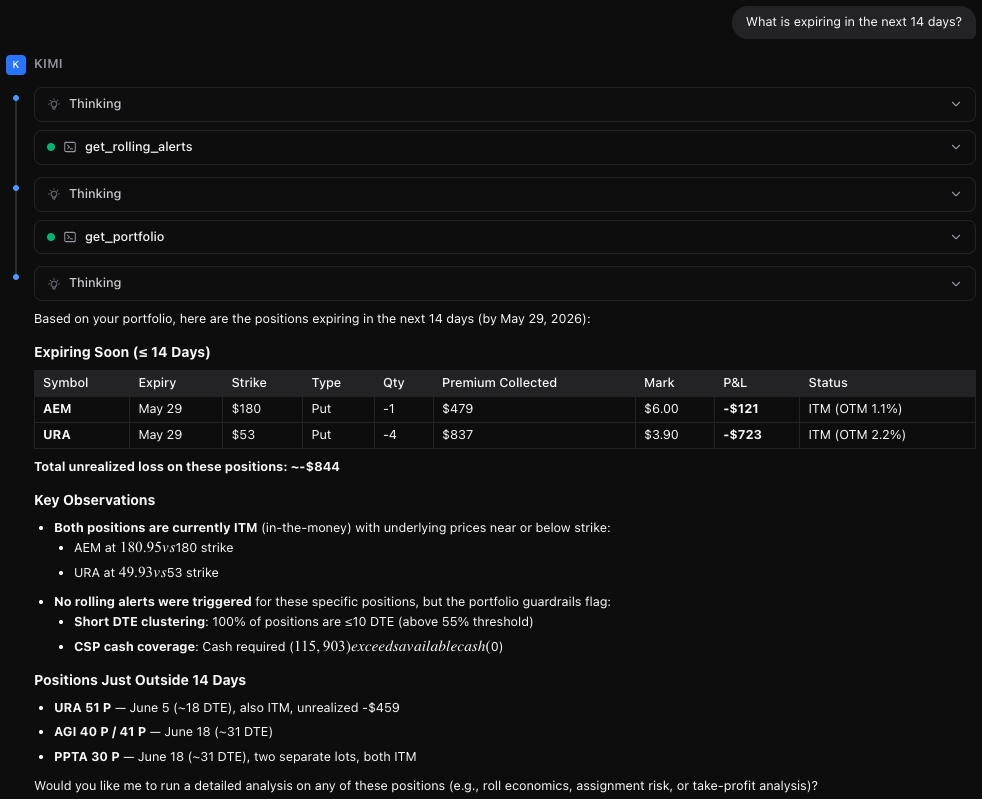
Ask Your Portfolio Anything
Connect Claude, Cursor, or Windsurf to your live portfolio data. No exports. No screenshots. Just conversation with real positions, scans, and roll analysis.
Tap to view full size
Natural language queries
Ask "What expires this week?" or "Find roll opportunities" and get answers backed by your live IBKR data.
Works with your AI
Claude Desktop, Cursor, Windsurf — use the AI you already pay for. We just expose the data.
Secure API access
Each user gets scoped API keys. Your data never trains an AI model. You control access.
Live portfolio tools
AI can pull portfolio views, run scans, analyze positions, and even trigger IBKR flex imports.
Professional Scanning & Screening Tools
Specialized tools for income-focused options traders with backtested data and IBKR integration
Covered Call Scanner
Find high-yield opportunities with backtested assignment rates
CSP Scanner
High-probability put opportunities for wheel strategies
Spread Tracker
Track credit spreads, iron condors, and multi-leg strategies with per-leg P&L and roll detection
Backtesting
Validate strategies with historical performance data
Wheel Strategy
Complete CSP to covered call cycle management
Free Screener
Covered call screening with no credit card required
Born To Sell Alt
Modern upgrade at a better price point
OptionStrat Alt
Professional tools at 60% less cost
Multi-Leg P&L
Understand true cost basis across complex positions, auto-detect legs, and see strategy-level P&L that IBKR doesn't show you
More from the platform
Sector breakdowns, LEAPS comparison and analytics, roll decision analysis, cost basis tracking, and income calendar views
Tap to view full size
Tap to view full size
Tap to view full size
Tap to view full size
Tap to view full size
Frequently Asked Questions
Everything you need to know about Days to Expiry and how it helps options traders
What makes Days to Expiry different from other options trading platforms?
What strategies does Days to Expiry support?
Is Days to Expiry free to use?
How does the Interactive Brokers integration work?
What is options backtesting and how does it help?
Can I use Days to Expiry with brokers other than Interactive Brokers?
Can I use AI to analyze my portfolio?
Learn Options Trading Strategies
Options Screener
Multi-strategy screening tool with backtesting
Covered Call Scanner
Find high-yield opportunities with backtested data
CSP Scanner
Wheel strategy opportunities with assignment analysis
Iron Condor Strategy
Profit from range-bound markets
Cash-Secured Puts Guide
DTE optimization & assignment risk
Covered Calls
ETF vs manual strategy comparison
LEAPS Options
Long-term investing with options
0DTE Trading
High-probability intraday playbook
Rolling Strategies
Extend positions & boost income
ETF Covered Call Finder
Discover high-yield income ETFs
Wheel Strategy Explained
Complete guide to wheel trading
Put Options Execution Guide
Step-by-step trading walkthrough
Built for the Expiration Workflow
Unlike generic options tools, Days to Expiry is purpose-built for systematic sellers who manage expiration cycles. We combine real-time market data with historical performance analytics so you can review positions by DTE, assess assignment risk, and decide what to do next — all in one dashboard instead of scattered spreadsheets.
Interactive Brokers Integration That Saves Hours
Connect directly via our Chrome extension for automatic trade synchronization, or upload your statement CSV for instant parsing. Our system normalizes every transaction—handling commissions, stock splits, and corporate actions automatically—so your income dashboardreflects accurate totals without manual reconciliation. Track premiums collected, weekly and monthly ROI, and analyze performance by underlying symbol, expiration date, or strategy type.
Triple-Strategy Scanner With Live Market Data
Our opportunity scanner simultaneously evaluates covered calls for income generation, cash-secured puts for strategic entry points, and LEAPS for leveraged exposure. Configure intelligent filters for assignment probability, target ROI, and days-to-expiration ranges to eliminate noise and focus on trades matching your criteria. Live pricing from market data feeds ensures your calculations reflect current conditions—not cached or delayed quotes.
Data-Driven Validation Through Historical Backtesting
Every scanned opportunity includes comprehensive historical backtesting showing how identical strike and DTE combinations performed over multiple market cycles. View assignment rates, win/loss distributions, and average hold times to understand the complete risk profile before committing capital. This evidence-based approach replaces guesswork with quantified probability analysis.
Advanced Position Management Tools
When market conditions shift, our roll decision analyzer compares multiple roll scenarios with projected P&L outcomes. The sector breakdown visualization helps identify concentration risks across your wheel strategy positions. Coverage intelligence clearly indicates which holdings are fully covered by options, partially hedged, or carrying naked exposure—providing a complete risk picture at a glance.
Start Free, Upgrade When Ready
Begin with our free covered call screener and basic portfolio tracking. When you need advanced capabilities like IBKR auto-sync, unlimited backtests, and priority support, upgrade to a premium plan. Compare us to Born To Sell or our OptionStrat alternative to see why traders are switching to modern, purpose-built options analytics. Ready to explore? View a live demo portfolioor dive into the strategy analyzer.