Days to Expiry — Options Portfolio Tracker logo
Days to Expiry
Options Portfolio Clarity

Options Selling Analyzer for Interactive Brokers

Find Your Best Option Selling Strategies & Track Performance

Juggling multiple option selling strategies on Interactive Brokers? Unsure which opportunities are best? Our analyzer connects directly to IB, discovers your best opportunities across covered calls, cash-secured puts, and spreads, and tracks your performance—all in one dashboard.

Options selling strategy comparison dashboard

Tap to view full size

Problem

Option Selling is Fragmented on Interactive Brokers

Too Many Strikes to Compare Manually — 50+ strikes per ticker

No Unified Strategy Picker — CC vs CSP vs spreads scattered across three screens

Assignment Tracking is Non-existent — Manual tracking in spreadsheets

Performance is Scattered Across Statements — Monthly statements, inconsistent data

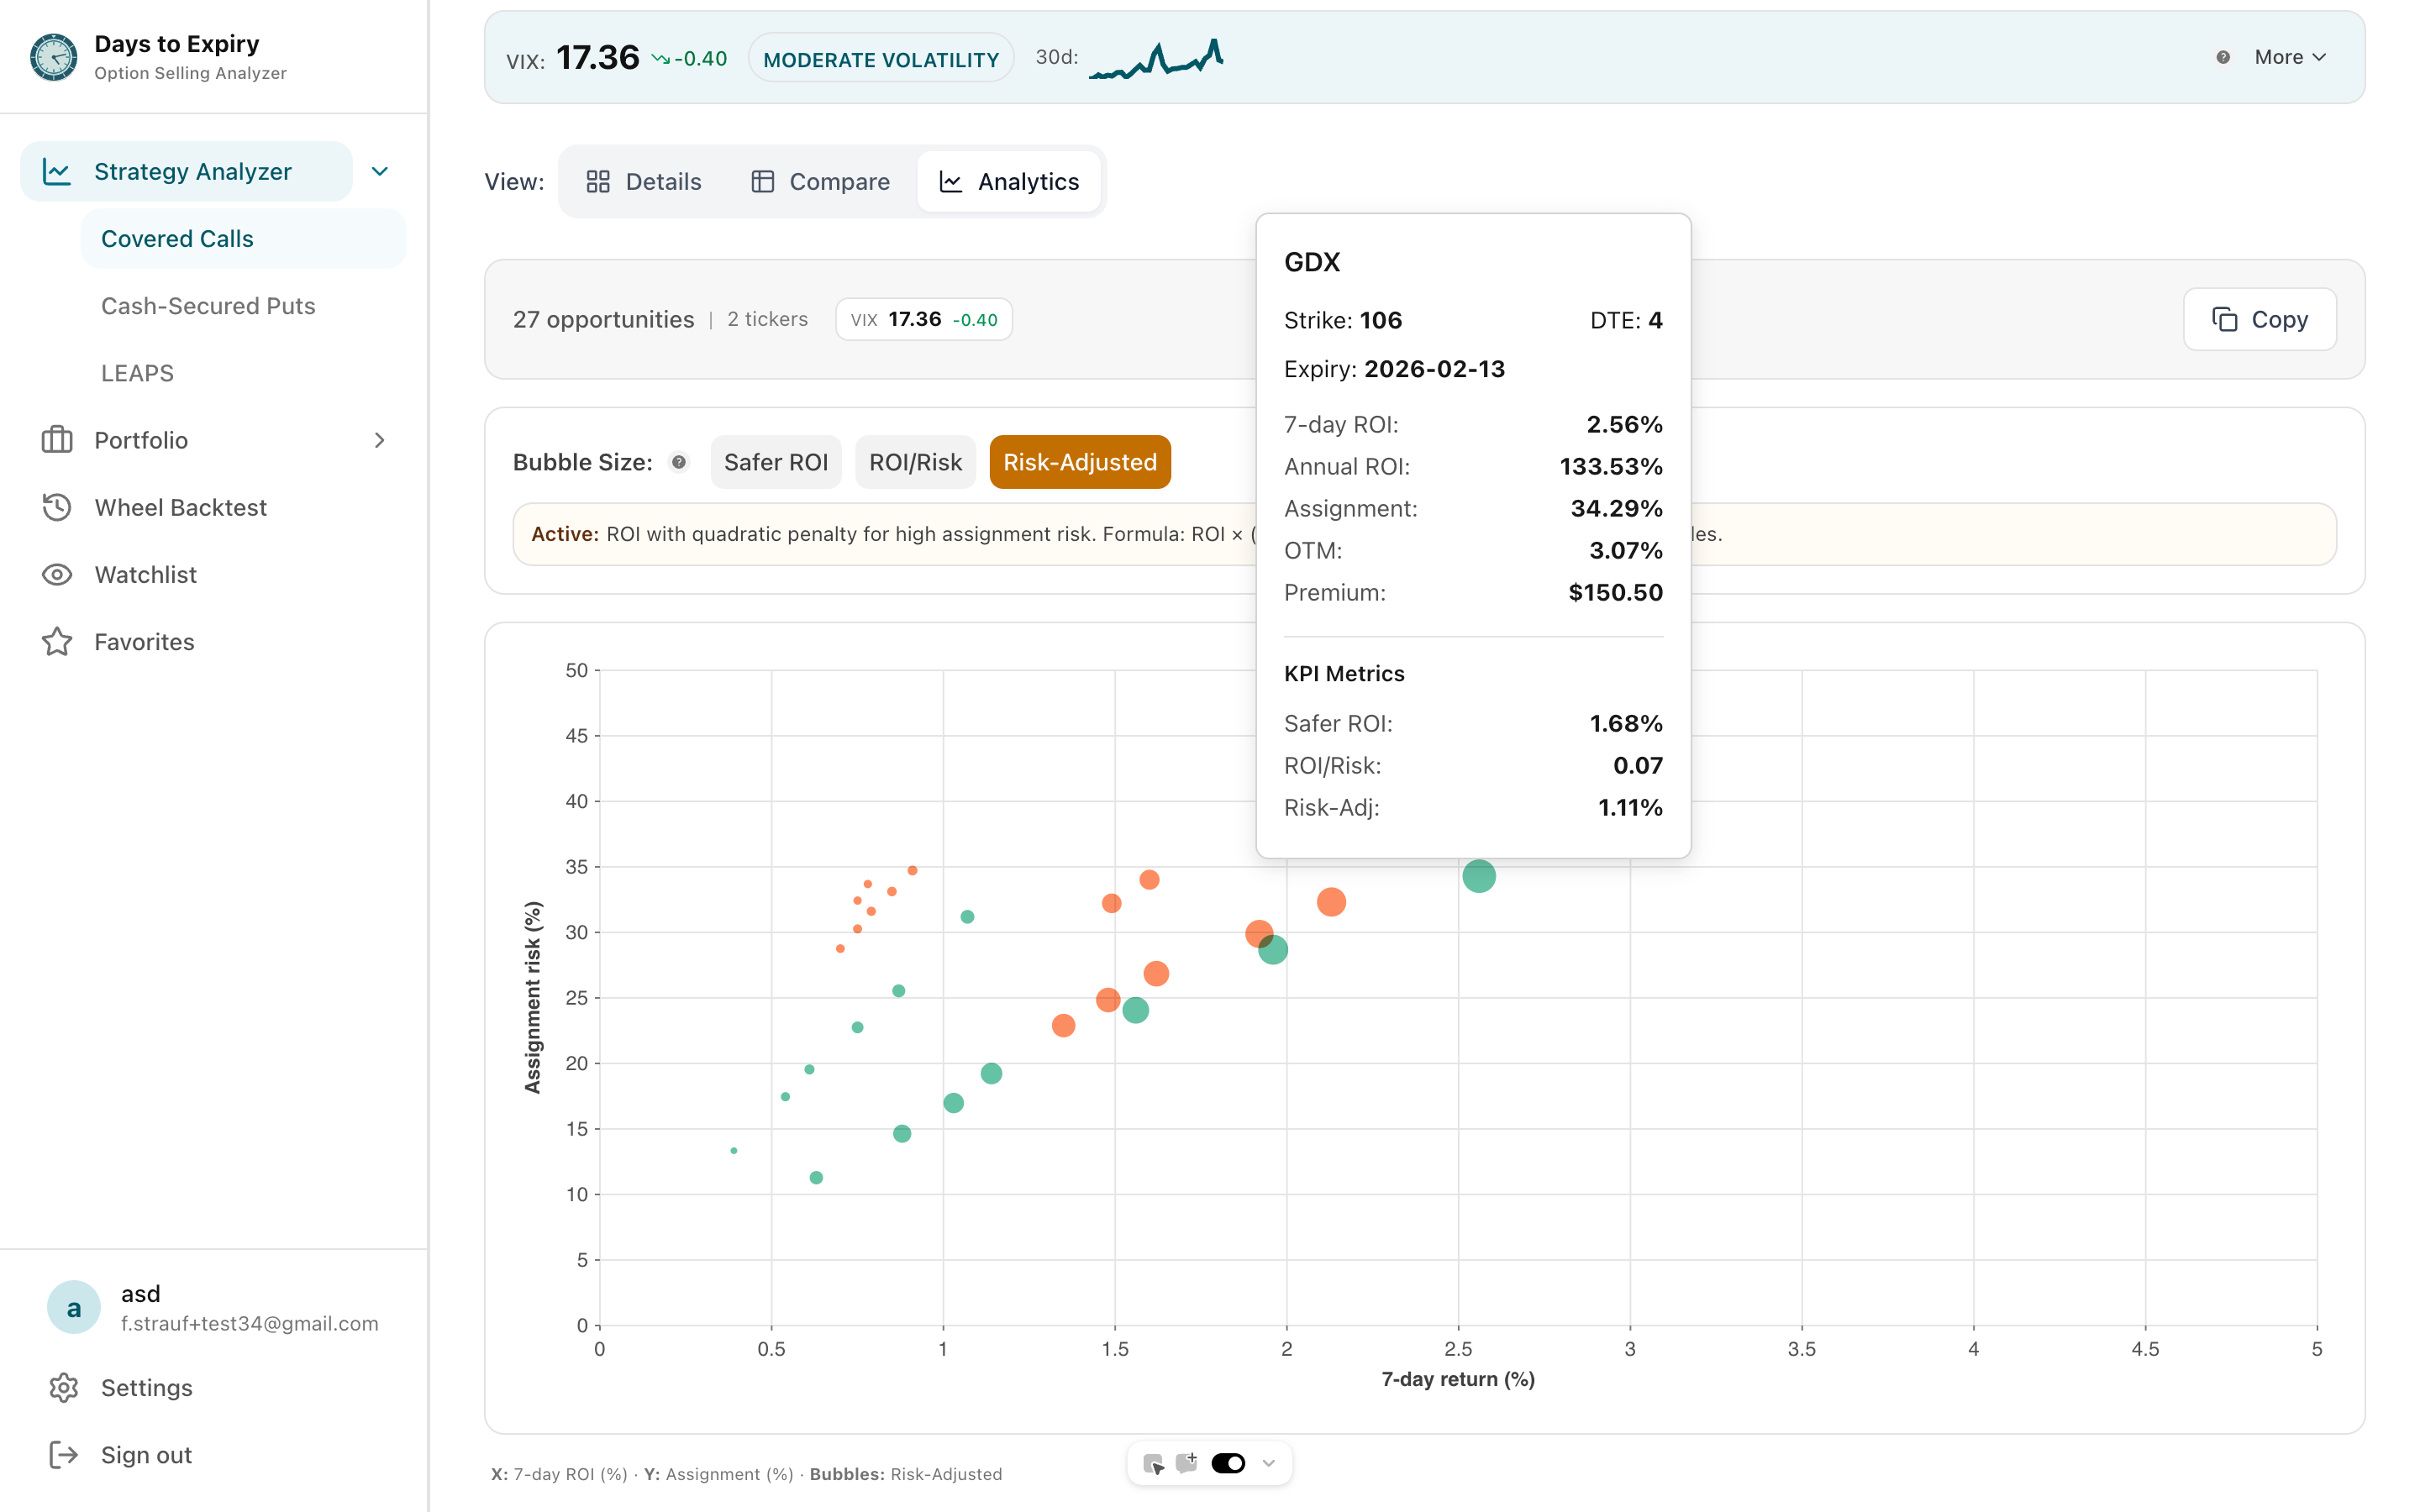
You're Probably Missing High-Yield Opportunities — No easy way to scan for best setups

Solution

Options Selling Analyzer

Unified Opportunity Finder

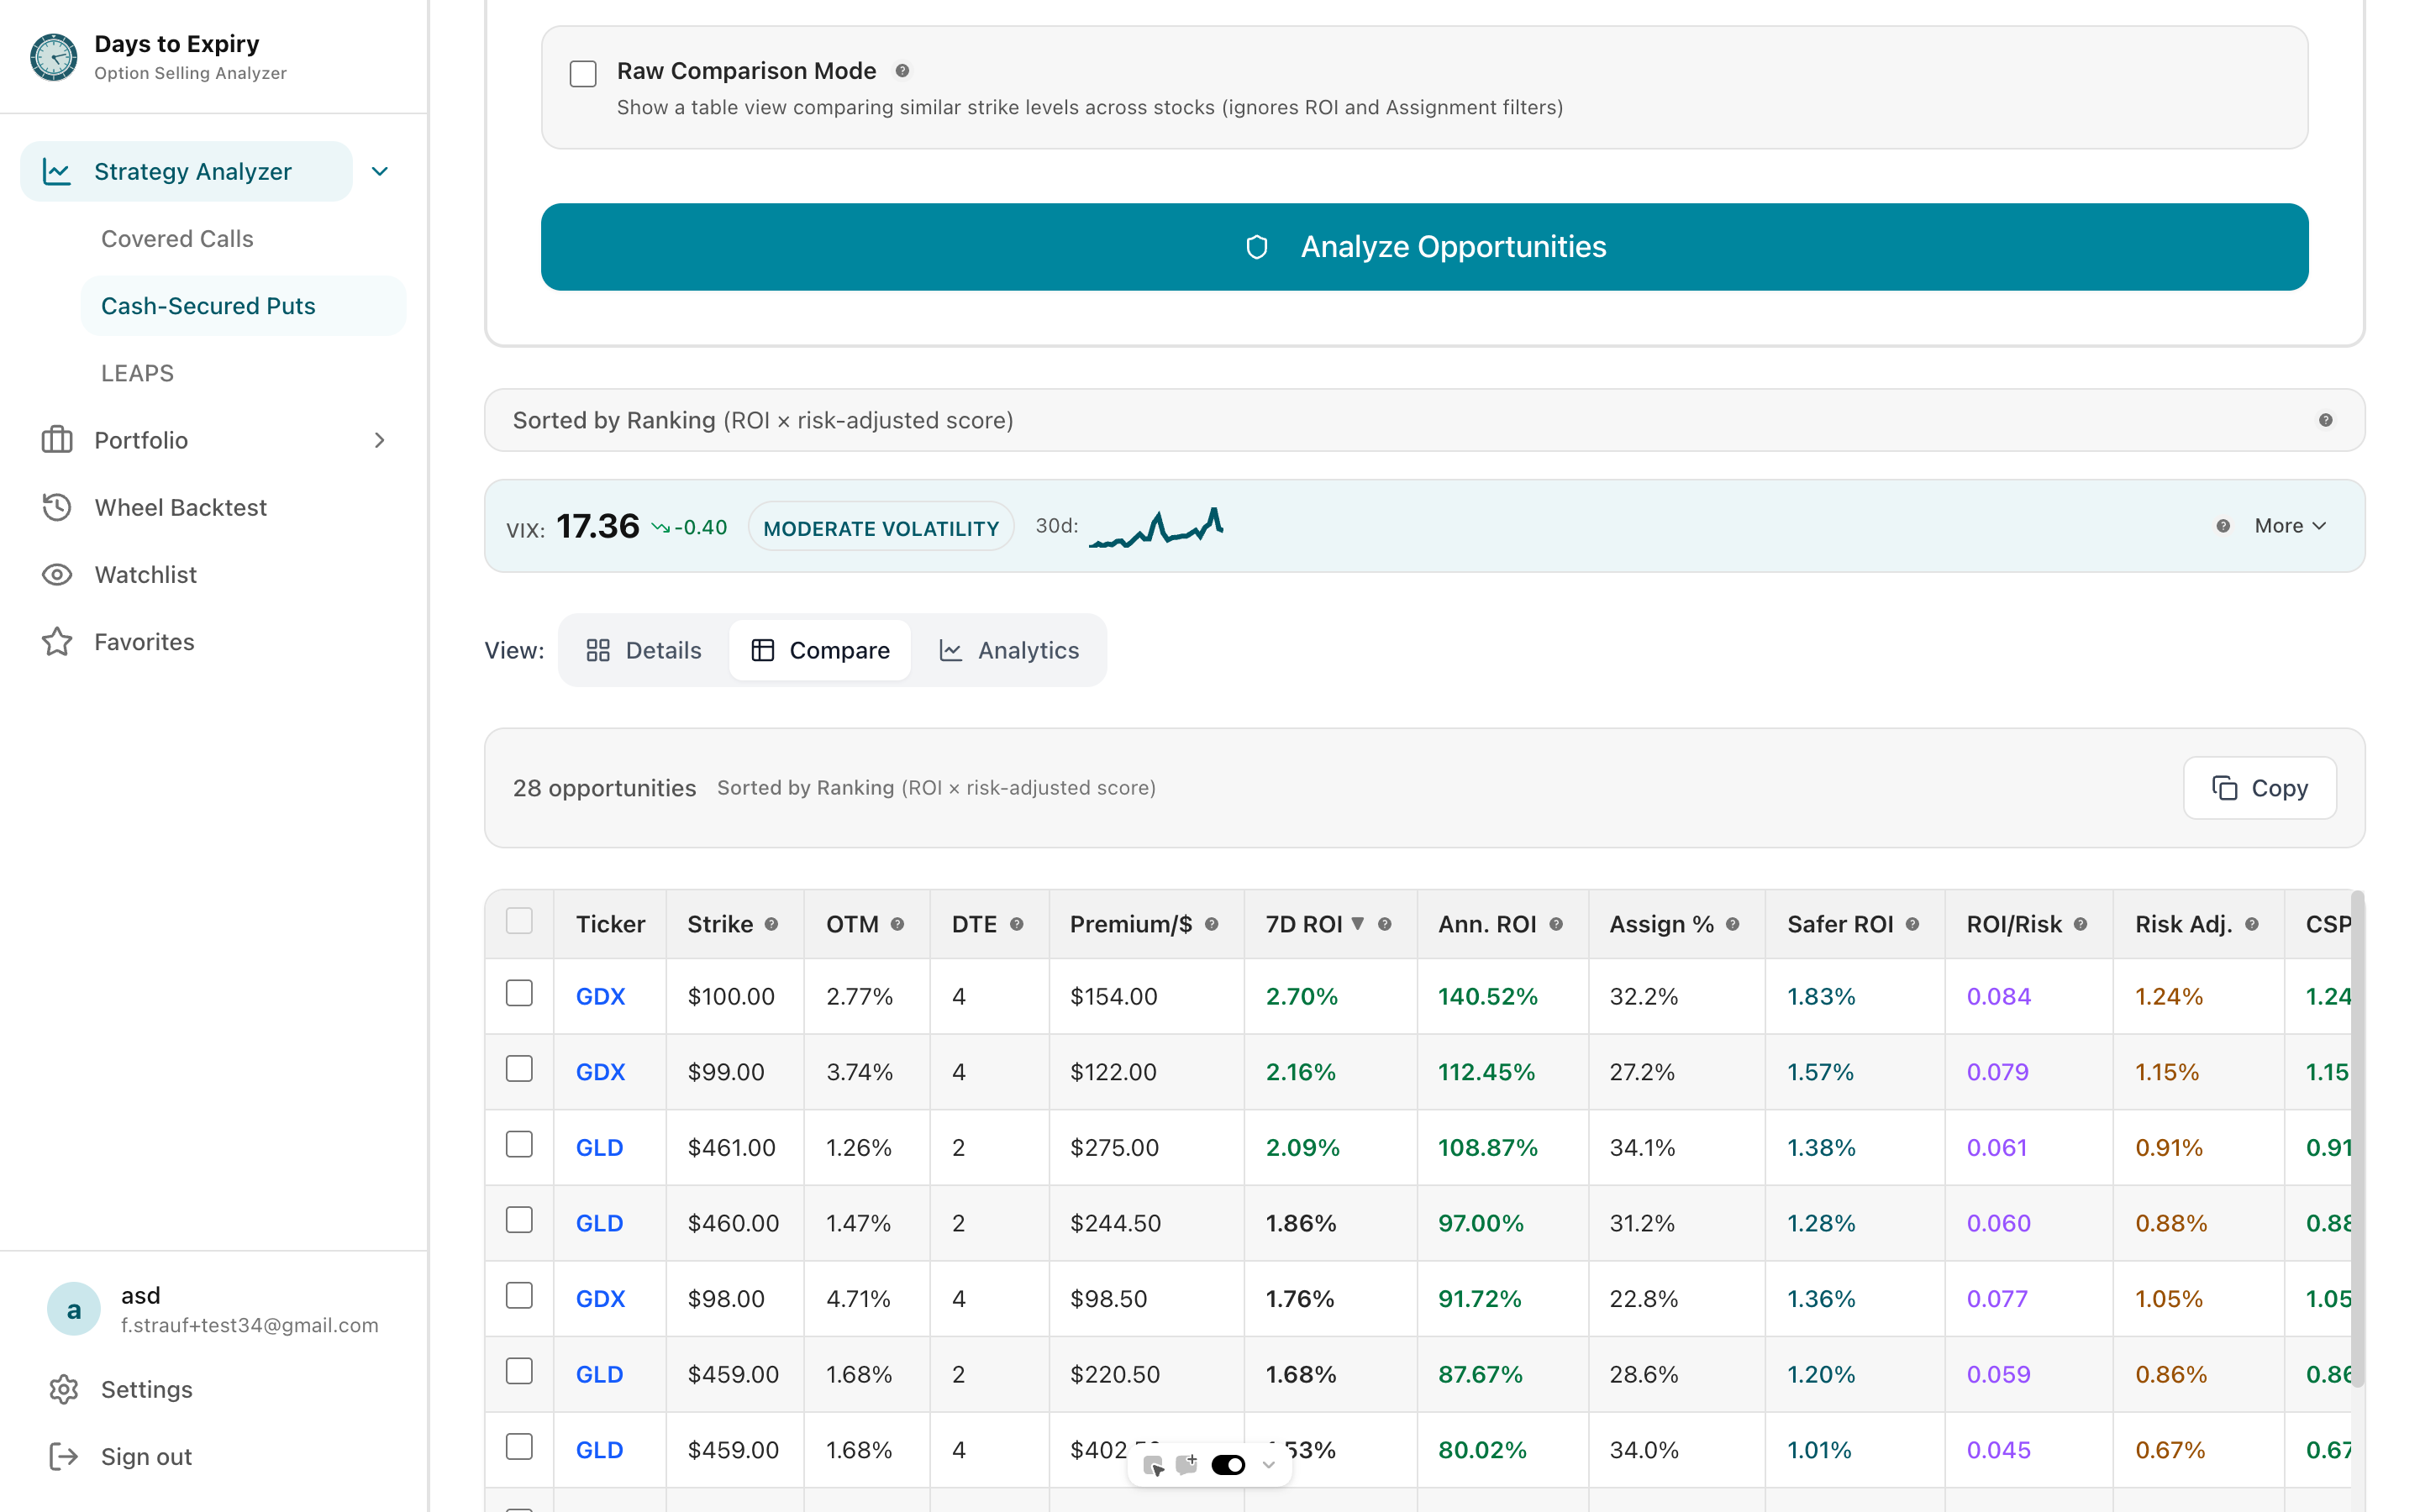
All strategies in one place

Real-time Portfolio Analysis

What can you deploy today?

Assignment Tracking

Auto-categorized by strategy

Strategy Recommendations

CC vs CSP for each ticker

Performance Dashboard

Total premium, ROI per strategy

Pattern Recognition

Which tickers/strategies perform best?

Strategy analytics showing performance by ticker and strategy

Tap to view full size

See Your Opportunities Live

Loading strategy analyzer…

Sample Portfolio Performance

DEMO

Demo Portfolio Overview

Explore positions, trades, income, and analytics with realistic sample data.

View Full Demo
Loading demo portfolio...

Want to track your own portfolio? Import your trades and see analytics like this.

Try Free
How it works

Get started in 3 simple steps

1

Connect Your IB Account

Authorize with OAuth (secure, read-only access to portfolio)

2

Discover Opportunities

Enter available cash and risk tolerance. Get ranked list of best trades RIGHT NOW

3

Track & Learn

Upload activity statements each month. Dashboard shows premium collected, assignments, returns by strategy

Real Example: Using the Analyzer

Your Portfolio:

  • 500 shares AAPL at $235
  • 300 shares XOM at $115
  • $25,000 cash

Opportunities Found RIGHT NOW:

  • Best CC on AAPL: Strike $245 | Premium $210 | ROI 48%
    Assignment probability: 20%
  • Best CC on XOM: Strike $120 | Premium $390 | ROI 55%
    Assignment probability: 15%
  • Best CSP with $25K: SPY $580 | Premium $1,050 | ROI 44%
    Assignment probability: 18%

Total monthly income from these trades: $1,650

Key Metrics

Premium Monthly

$1,650

Annualized Income

$19,800

Assignment Rate

25%

Annualized ROI

34%

Related Resources

Frequently Asked Questions

Everything you need to know about getting started

Is my Interactive Brokers data safe?

Yes. We use OAuth 2.0 (never see your password), request read-only permissions, encrypt data in transit and at rest. You can revoke access anytime.

Which IB account types are supported?

Individual accounts, joint accounts, IRAs, corporate accounts, paper trading. All account types work. Connect multiple IB accounts if you have them.

What data do you read from my IB account?

Portfolio positions (stocks, ETFs, cash), options chains (available strikes, premiums, Greeks), and trade history (for backtesting and pattern recognition).

Can I execute trades directly from the analyzer?

Yes, one-click trading. See an opportunity and execute directly in IB without leaving the analyzer.

How do I upload my activity statement?

Export from IB (Account to Account Statement to Download CSV). Upload to analyzer monthly. Auto-categorizes trades by strategy.

Ready to Get Started?

Join traders who are already using our tools to make better decisions.